
Figure 7 |. MLL1 is required for proliferation of CPChigh HCC cells in vitro and in vivo.
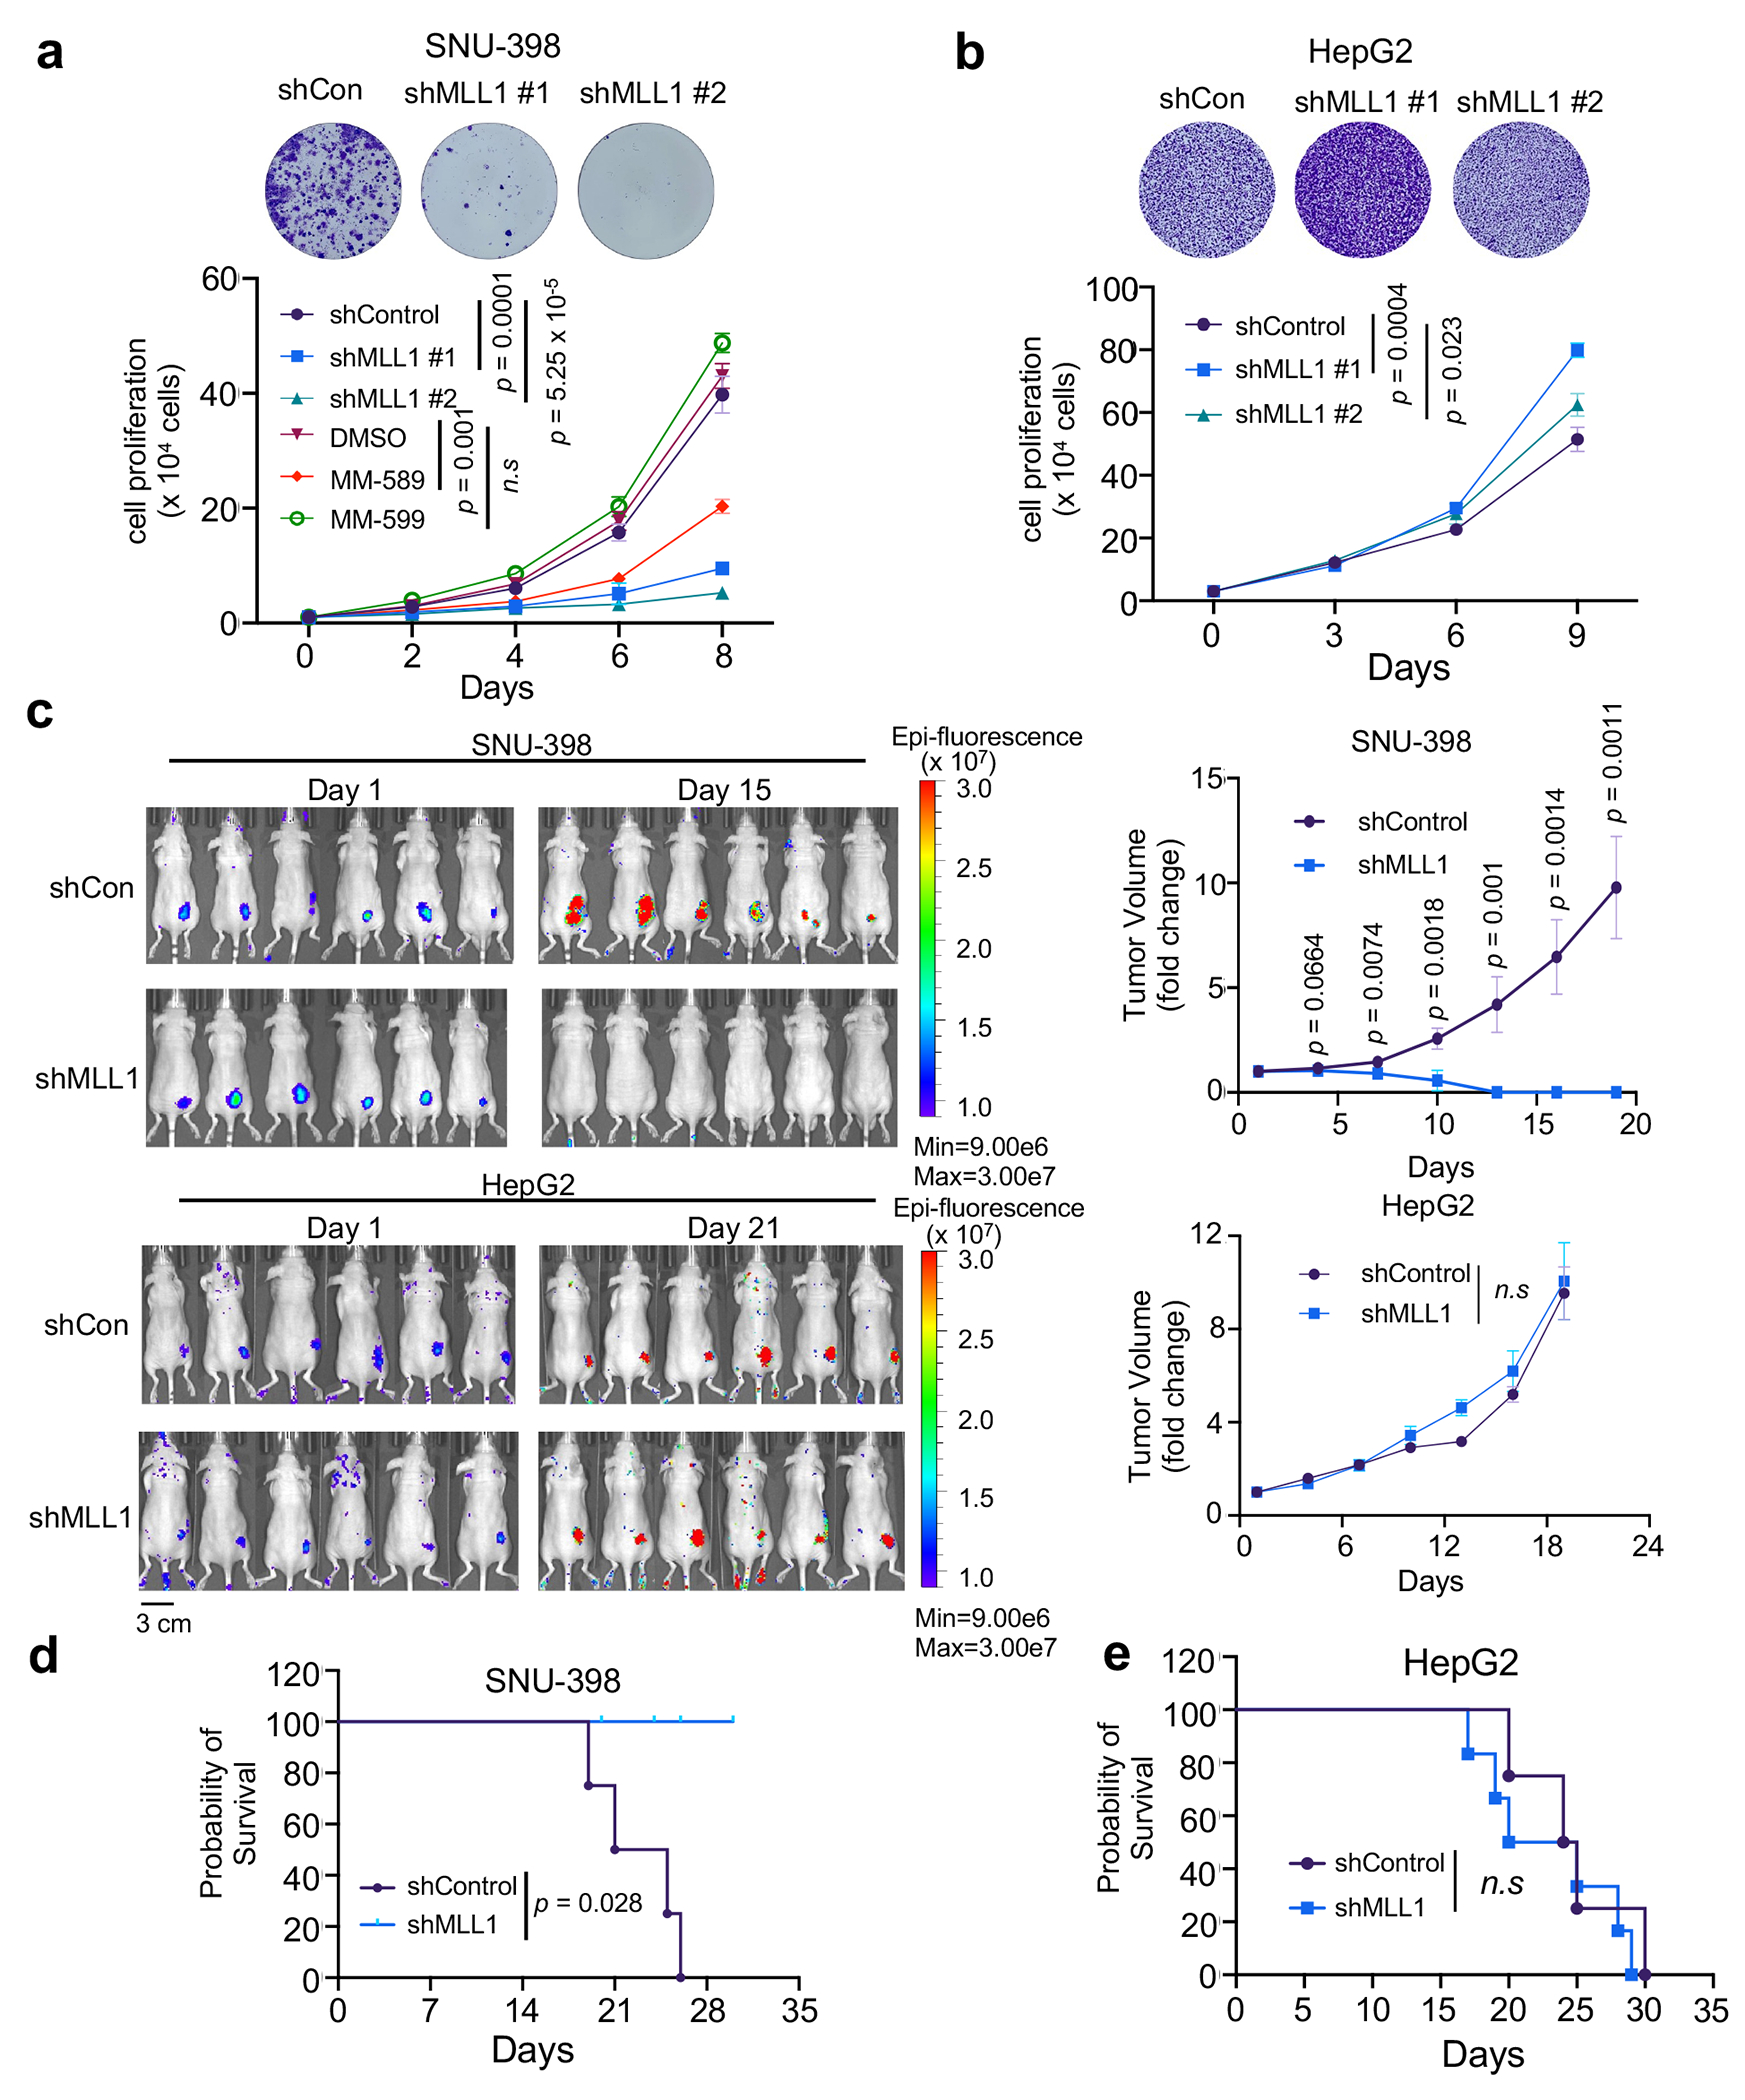
(a) and (b) Top, crystal violet stain of cell colonies of SNU-398 (a) and HepG2 (b) 72 hrs after control or MLL1 shRNA treatment. Representative images from three independent experiments were presented. Bottom, growth curves for SNU-398 (a) and HepG2 (b) cells treated with indicated shRNAs or compounds. Average results from three independent experiments were presented. Standard deviations were presented as error bars. The p-value was calculated using two-tailed unpaired Student’s t-test for cells on Day 8. n.s, p > 0.05.
(c) Bioluminescence images of SNU-398 (top) or HepG2 (bottom) xenografts at Day1 and Day15 (SNU-398) or Day 21 (HepG2) post subcutaneous injection. Control or MLL1 shRNA treatment was indicated on left. Heatmap key for bioluminescence intensity detected by IVIS Spectrum after GFP excitation is shown. Fold change of tumor volumes is shown on the right. Data were presented as average ± s.e.m of six tumors in each group. Two-tailed unpaired Student’s t-test was performed to calculate the p-values. n.s., p > 0.05.
(d) and (e) Kaplan-Meier survival curves for SNU-398 (d) and HepG2 (e) xenografts (n=8 per group). Median survival were 23 days (SNU-398) and 24.5 (HepG2) days for control mice, and 22.5 days (HepG2) for shMLL1 mice. Experimental end point is declared when tumor volume reaches 1000 mm3. The p-value was determined by log-rank test. n.s, p > 0.05.