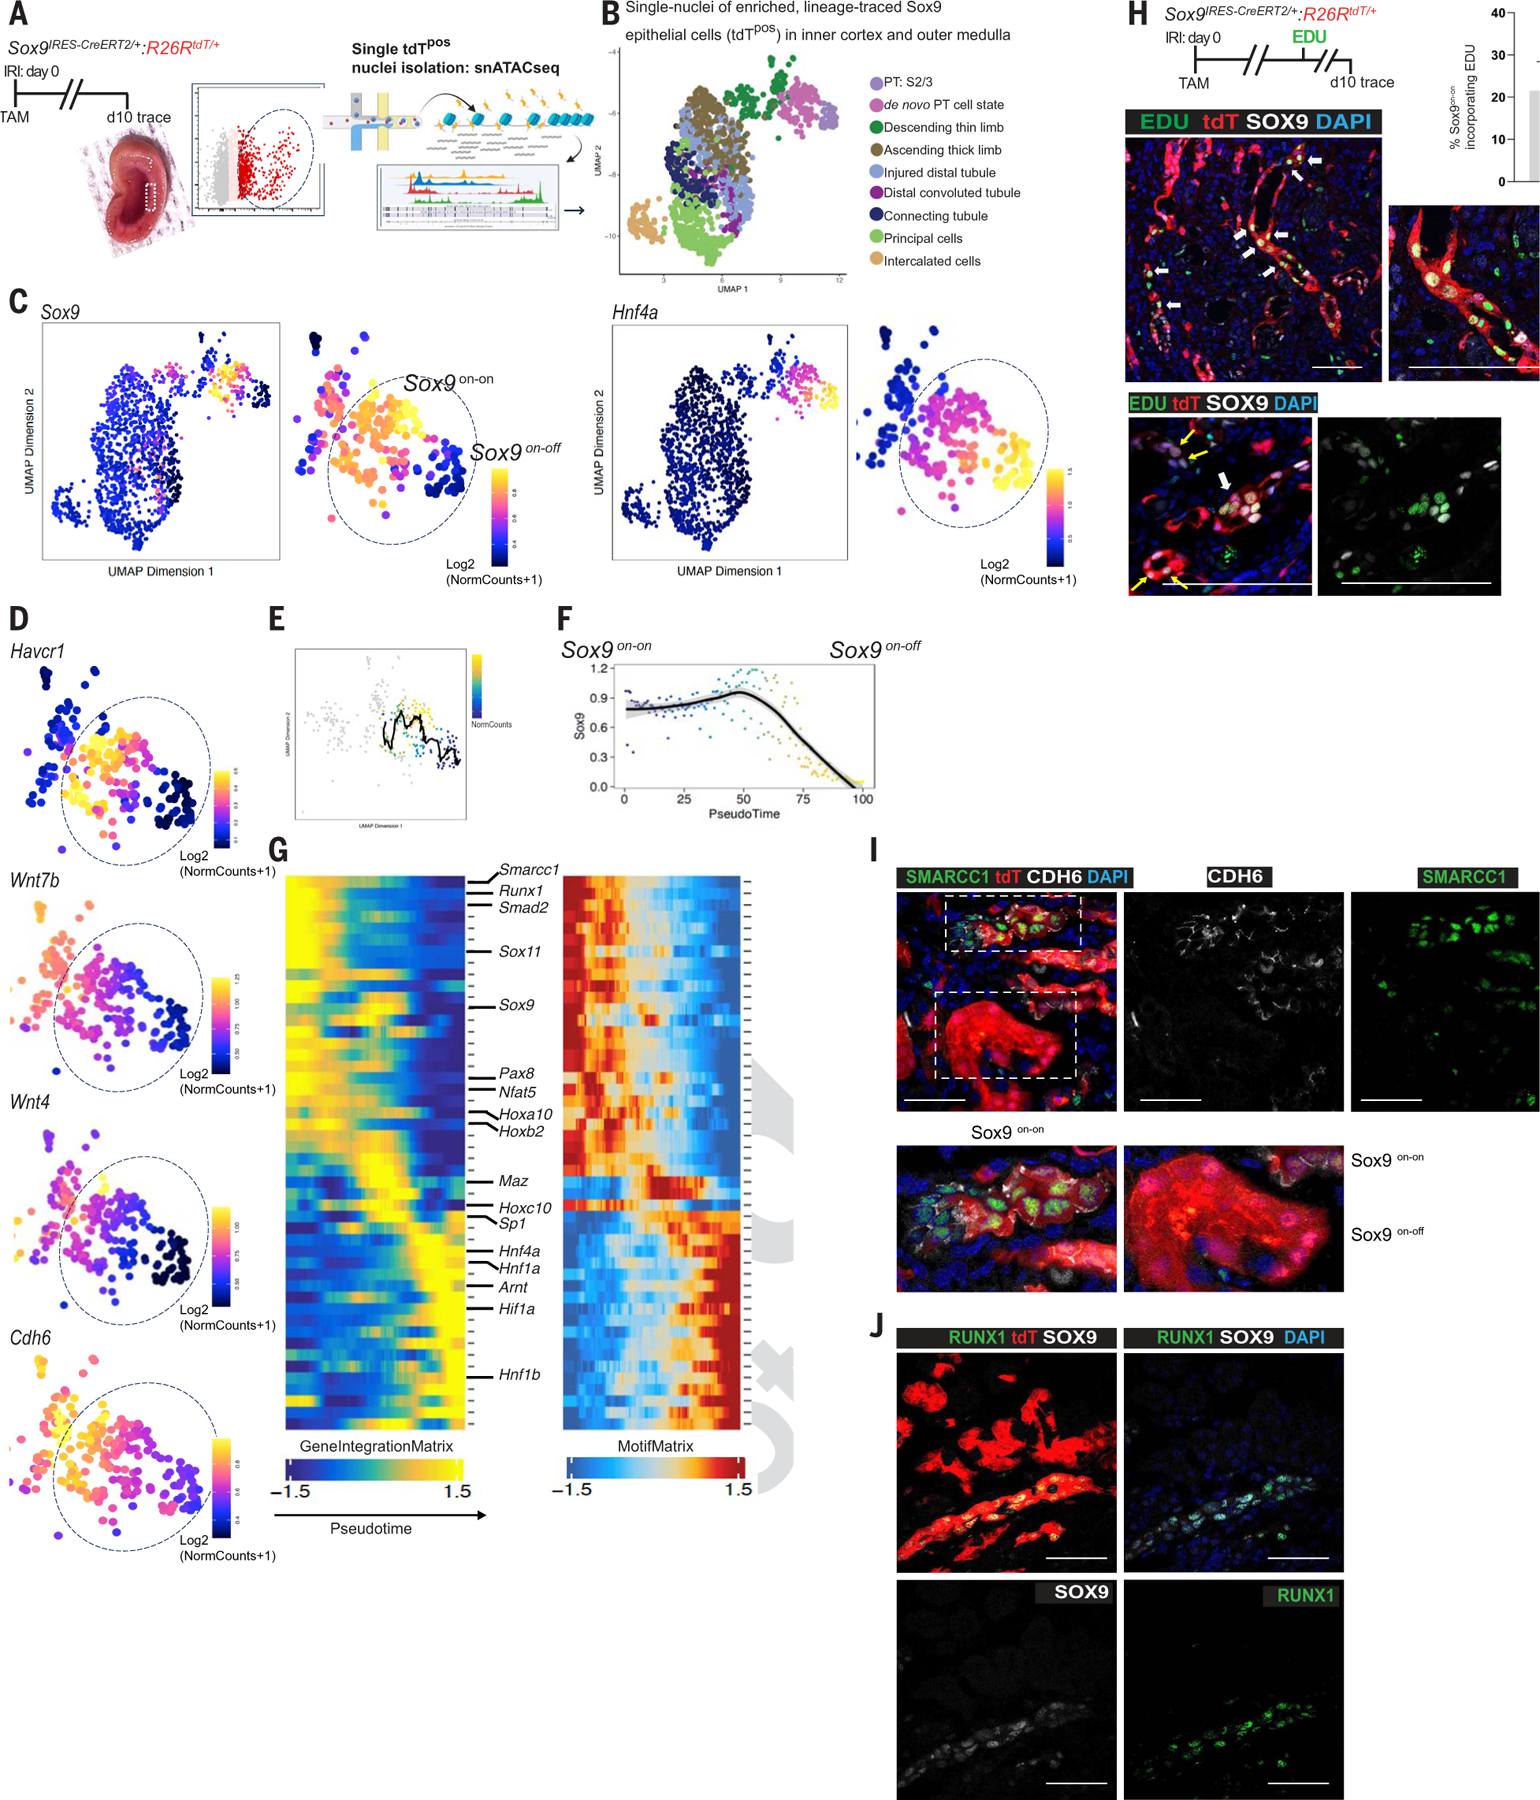
Fig. 4. Epigenetic reprogramming of single Sox9on-on nuclei to a nephron progenitor–like state contrasts with the Sox9on-off counterpart, which reverts to normal PTEC.

(A) Schema of the workflow to obtain single nuclei of the FACS-enriched tdTpos Sox9-descendants at day 10 after injury. Rectangle (inset) highlights the dissected region showing the inner cortices and outer medulla, the site of relatively extensive PTEC loss. (B) Integration of scRNA-seq and snATAC-seq showing the cellular identity of single-tdTpos nuclei (n = 2 animals). (C) Identification of Sox9on-on and Sox9on-off single nuclei: Chromatin accessibility revealing clustering of tdTpos descendants based on relatively open and closed chromatin accessibility state of Sox9. Sox9on-off nuclei exhibited open chromatin accessibility for Hnf4a, a known marker of healthy, mature PTECs, suggesting that the Sox9-lineage that regenerated normal PTECs closed chromatin accessibility for Sox9. (D) UMAP representation of chromatin accessibility analysis showing the relatively open chromatin state of Havcr1, Wnt7b, Wnt4, and Cdh6 versus their accessibility state in Sox9on-off nuclei. (E and F) Sox9 trajectory analysis with scRNAseq-imputed gene expression (E) and pseudotime (F) scale showing the Sox9on-on → Sox9on-off transition. (G) Heatmaps of cross-platform linked genes involved in the transcriptional cascade during Sox9on-on → Sox9on-off transition. Note that the highlighted genes in Sox9on-on nuclei are linked with tissue development and/or nephrogenesis, and the Sox9on-off nuclei displayed open chromatin accessibility for Hnf4β, another known marker of healthy, mature PTECs in addition to Hnf4a. (H) Schema of EDU regime and co-immunostaining for SOX9 and EDU showing SOX9postdTposEDUpos cells. Two representative images are shown, with the lower panel demonstrating a cluster of such cells. n = 3 animals. (I and J) Co-immunostaining for SMARCC1 and CDH6 showing SMARCC1 expression confined to day 10 CDH6pos Sox9 lineage cells (I), and RUNX1 and SOX9 co-immunostaining showing RUNX1 restricted to Sox9on-on versus Sox9on-off lineage (J) as predicted by (G), thus validating Sox9 lineage-specific snATAC-seq datasets. n = 2 animals. Scale bars, 100 μm.
