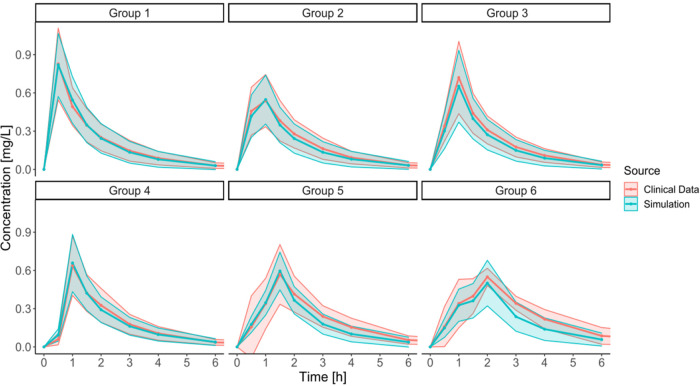
Figure 7.
Final IVIVP model simulations (n = 100) comparison with the clinical trial outcome, stratified into specific gastric motility types. Data are presented as means (line) with standard deviation (SD) values (ribbons). The following kGE distribution was used in the simulations: 3 1/h for Group 2, 2 1/h for Groups 5 and 6; otherwise, a random kGE value from the 3–14 1/h range. The final Groups 5 and 6 involved the intragastric stresses from Group 3.

