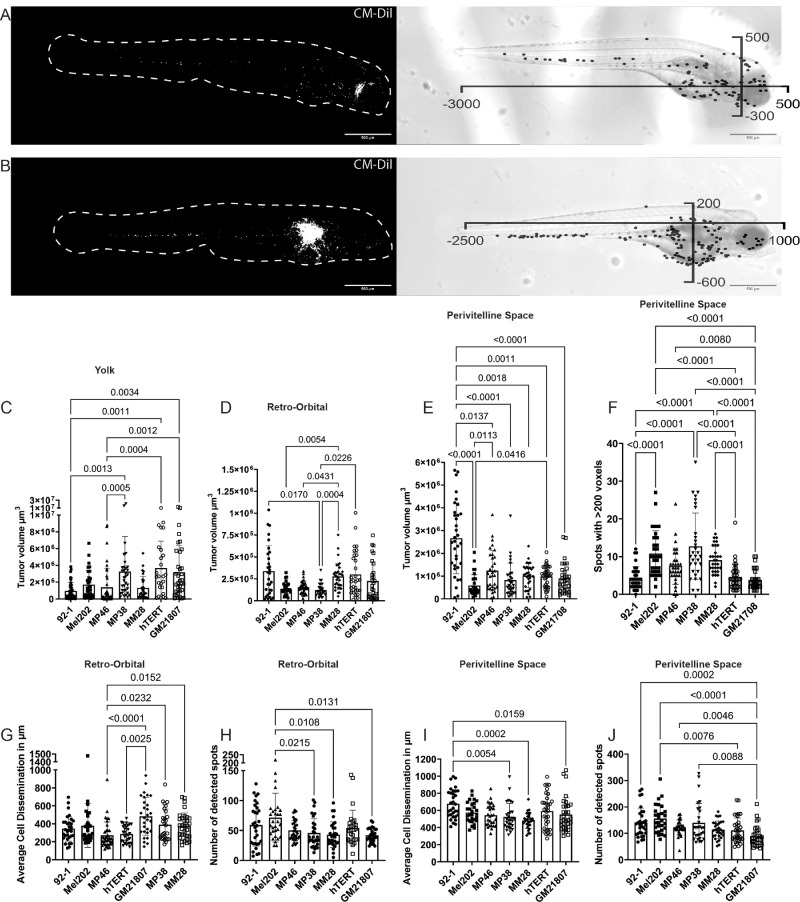
Figure 3.
Quantification of UM zebrafish xenografts. (A) Max projected Z-stack of retro-orbital injected zebrafish xenograft at 3 dpi with cells in white followed by an X-Y plot overlaying the corresponding bright field image. (B) Max projected Z-stack of perivitelline space-injected zebrafish xenograft at 3 dpi with cells in white followed by an X-Y plot overlaying the corresponding bright field image. (C, D, E) Overview of tumor volume analysis per cell line in the yolk sac (92.1, n = 42, Mel202, n = 31, MP46, n = 40, MP38, n = 34, MM28, n = 28, hTERT-melanocytes, n = 26, and GM21807, n = 35), retro-orbital region (92.1, n = 30, Mel202, n = 30, MP46, n = 38, MP38, n = 28, MM28, n = 33, hTERT-melanocytes, n = 32, and GM21807, n = 31), or perivitelline space injections (92.1, n = 35, Mel202, n = 31, MP46, n = 33, MP38, n = 31, MM28, n = 33, hTERT-melanocytes, n = 38, and GM21807, n = 33). (F) Number of detected objects larger than 200 voxels in perivitelline space-inoculated zebrafish xenografts. (G) Cell dissemination distance per cell line in retro-orbital inoculated zebrafish larvae at 3 dpi. (H) Number of disseminated cells detected per cell line in retro-orbital inoculated zebrafish larvae at 3 dpi. (I) Cell dissemination distance per cell line in perivitelline space-inoculated zebrafish larvae at 3 dpi. (J) Number of detected disseminated cells per cell line in perivitelline space-inoculated zebrafish larvae at 3 dpi.

