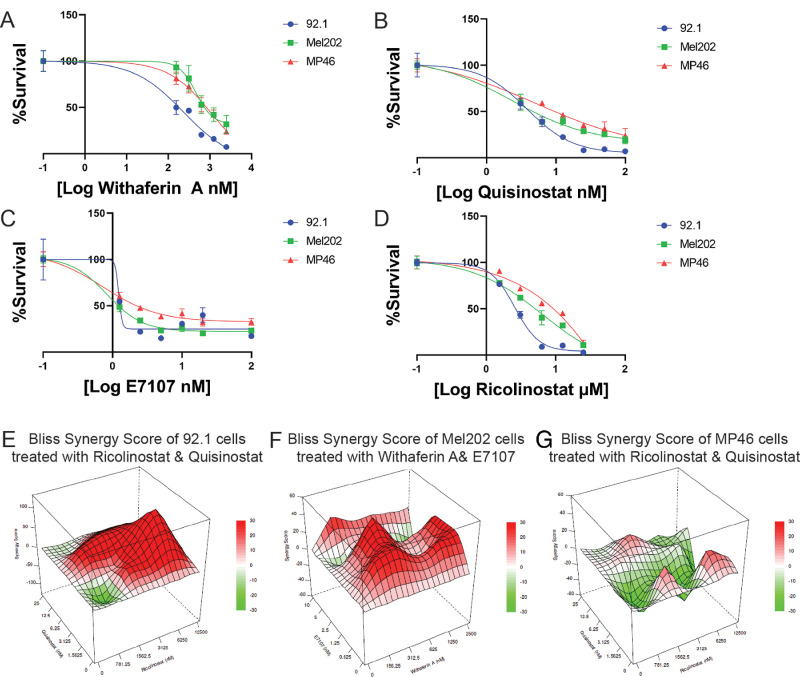
Figure 4.
Dose‒response curve and synergy plots for UM cells. (A) Dose‒response curve of withaferin A. (B) Dose response curve of quisinostat. (C) Dose‒response curve of E7107. (D) Dose‒response curve of ricolinostat. Synergy scores are plotted in a 3D graph, with synergy scores on the Z-axis, the concentration of drug A on the Y-axis and the concentration of drug B on the X-axis. (E) Bliss synergy score plot of ricolinostat and quisinostat in 92.1 cells. (F) Bliss synergy score plot of Mel202 cells treated with withaferin A and E7107. (G) Bliss synergy score plot of ricolinostat and quisinostat in MP46 cells.

