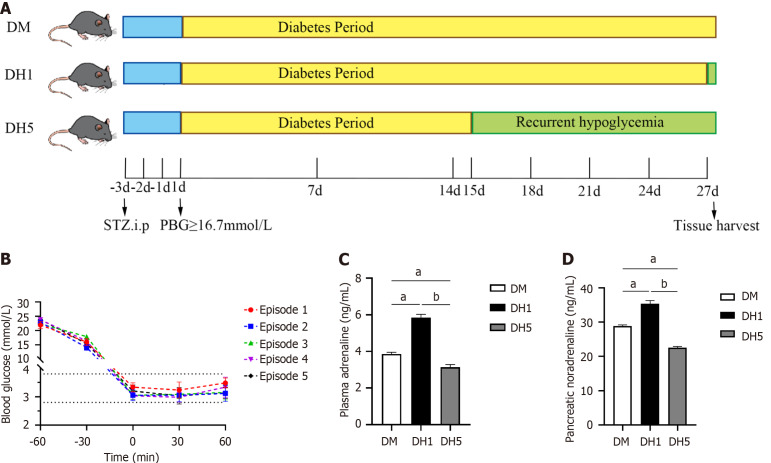
Figure 1.
Diabetic mice with five hypoglycaemic episodes exhibit impaired hypoglycaemic counterregulation. A: Flow chart depicting the modeling process, with some content sourced from Scidraw; B: Fluctuations in blood glucose levels in diabetic mice following repeated insulin interventions; C: Alterations in plasma adrenaline levels; D: Changes in pancreatic noradrenaline levels. All the data are presented as the the mean ± SE. aP < 0.01 vs diabetic mice; bP < 0.01 vs diabetic mice with a single hypoglycaemic episode; PBG: Postprandial blood glucose; DM: Diabetic mice; DH1: Diabetic mice with a single hypoglycemic episode; DH1: Diabetic mice with a single hypoglycaemic episode; DH5: Diabetic mice with five hypoglycaemic episodes.

