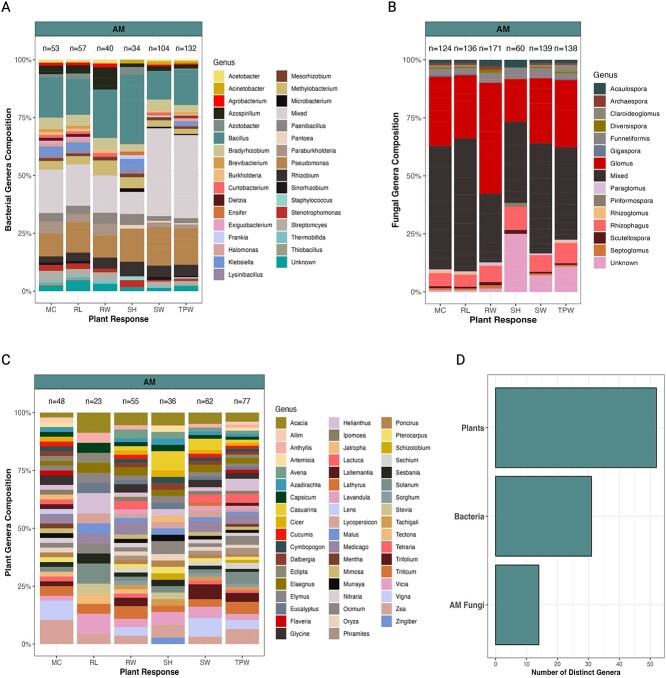
Figure 1.
Distribution of organisms used in AM studies. The composition of bacterial (A), fungal (B), and plant (C) genera of studies used in our meta-analysis is shown. The x-axis displays the six plants responses that were analyzed in our study. The abbreviations are as follows: MC = mycorrhizal fungi colonization percentage, RL = plant root length, RW = plant root weight, SH = plant shoot height, SW = plant shoot weight, and TPW = total plant weight. The total number of inoculants used in each analysis is denoted above each stacked bar. See Supplementary Table S1 for additional information about the selected studies. (D) Number of unique genera across studies.

