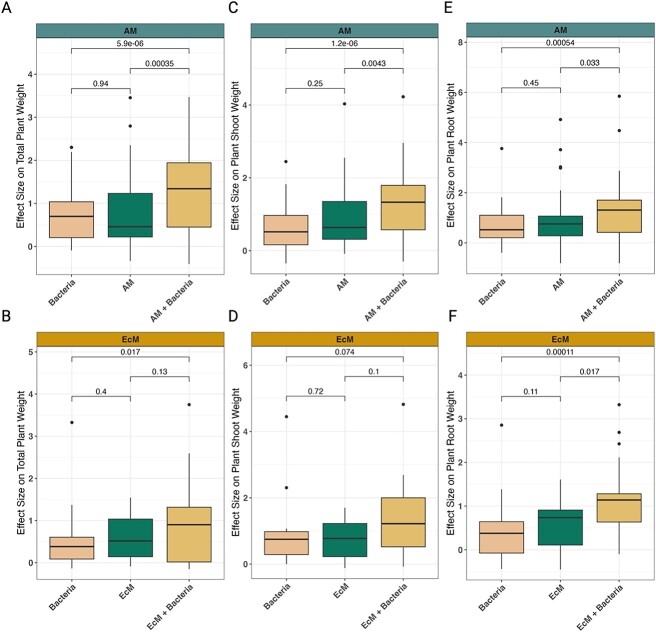
Figure 3.
Biomass plant response effect sizes of single and co-inoculations of bacteria and mycorrhizal fungi. Changes in effect sizes (y-axis) for total plant weight (A and B), plant shoot weight (C and D), and plant root weight (E and F) are shown for both AM fungi and EcM fungi across different inoculation types (x-axis). The P-values for each comparison are provided, where P<.05 is considered a significant difference. Study information can be found in Figs 1 and 2 and Supplementary Table S1. The linear regression model outputs are listed in Table 1, Supplementary Tables S2, and S3.

