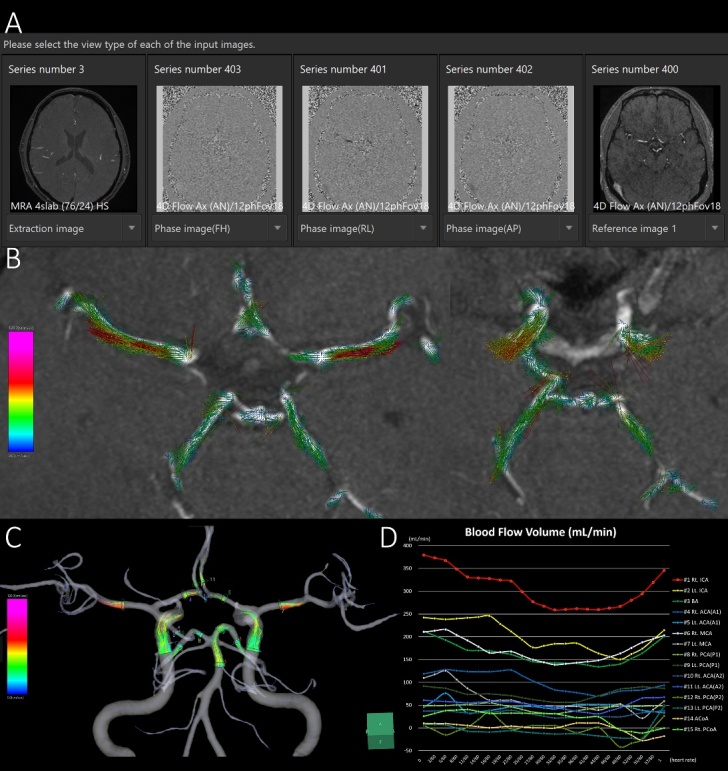
Figure 1.

Schematic diagram of 4D flow MRI analysis in representative healthy middle-aged participants. The phase-contrast (PC) images on the tri-axial direction and magnitude images of 4D flow MRI are integrated with high-resolution time-of-flight MR angiography (A). The PC images on each tri-axial direction provide the flow velocity distribution of the direction of the magnetic field gradient. The 3D flow vector and its motion in one cardiac cycle are visualized on the 4D flow application. The flow velocity vectors on the 2D display (B) and streamlines on the 3D display (C) at 15 ROIs are shown. (D) the x-axis is the division time during one cardiac cycle, and the y-axis is the blood flow volume (mL/min).
