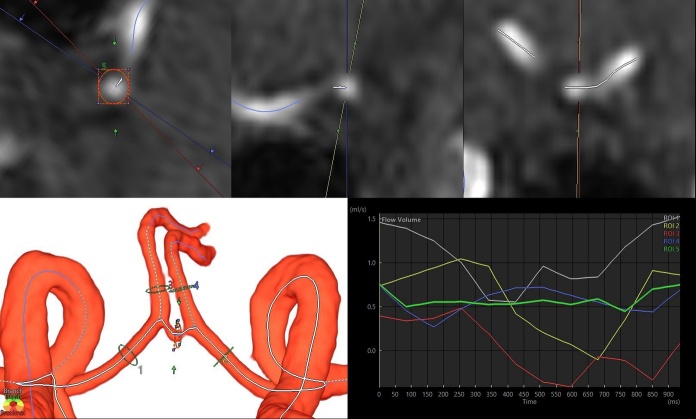
Figure 2.
Cross-sectional region of interest (ROI) for flow velocity measurement in bilateral anterior cerebral arteries (ACAs) and anterior communicating artery (ACoA). The upper three figures are 2D oblique views of ACoA, with a cross section orthogonal to the centerline automatically generated on the left. The 3D volume-rendering image in the lower left depicts the automatically generated centerline after extraction of the circle of Willis. The line graph in the lower right shows the change in flow volume in the five ROIs during one cardiac cycle.

