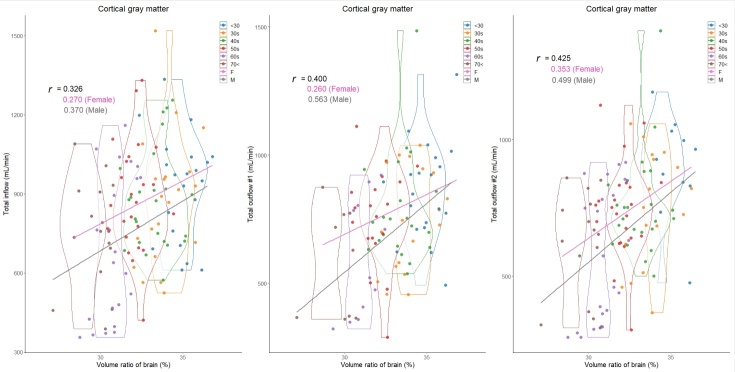
Figure 3.
Distribution of cortical gray matter volume ratios (%) and intracranial blood flow (mL/min) classified by age and sex. Violin plots show the distribution in each age group and straight lines indicate linear regression equations by sex. The y-axis of the left scatter plot shows the total inflow, which was defined as combined blood flows of bilateral ICAs and BA; that of the middle shows the total outflow #1, which was defined as combined blood flows of bilateral ACAs (A1), MCAs, and PCAs (P1); and that of the right shows the total outflow #2, which was defined as combined blood flows of bilateral ACAs (A2), MCAs, and PCAs (P2). Color coding indicates age and sex classifications as shown in the legend.

