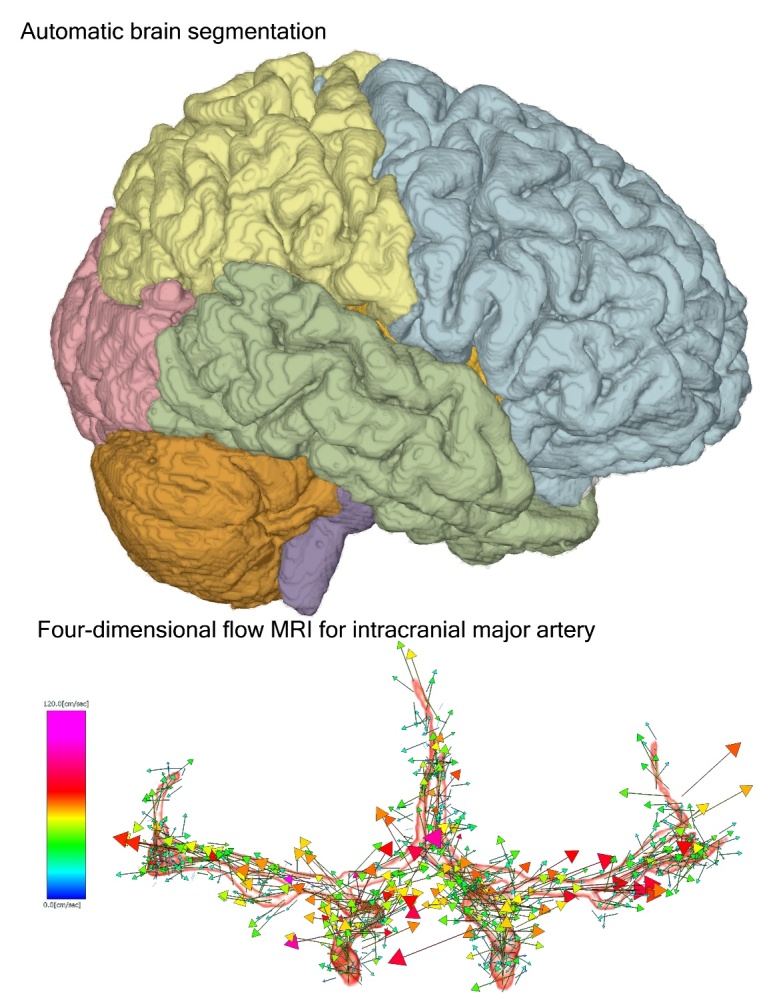
Figure 8.

Two applications for 3D workstations used in this study. The upper figure shows the 3D view of automatically segmented brain using Brain Subregion Analysis application. The lower figure shows a 3D vector of flow velocity in the main cerebral arteries around the circle of Willis on the 4D flow application.
