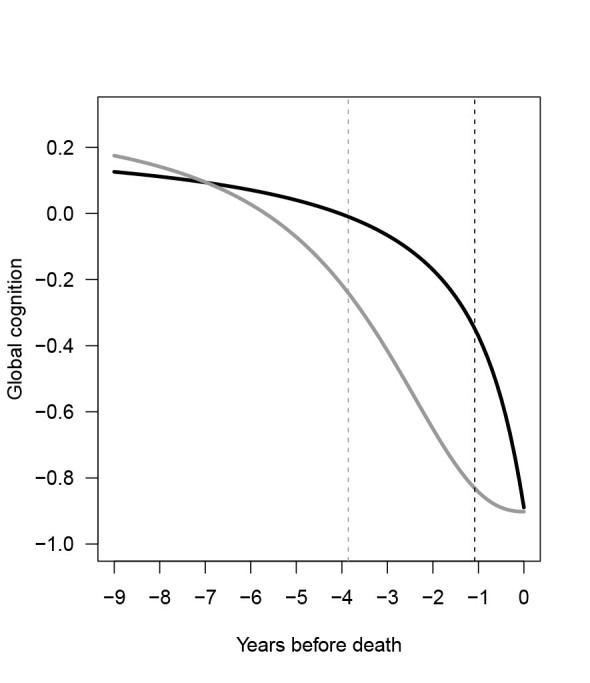
Figure 1.

The non-linear trajectories of late-life global cognition, by two pT308AKT1/total AKT1 levels. The curves show the trajectories of global cognition during the last nine years of life by two pT308AKT1/total AKT1 levels. The black curve represents the trajectory for study participants with pT308AKT1/total AKT1 level at 25th percentile, and the gray curve shows the trajectory for participants at 75th percentile, based on a sigmoidal mixed-effects model adjusting for age at death, sex, and education (N=147). The black and gray dash lines show the point in time at which half of the cognitive decline occurred for participants with pT308AKT1/total AKT1 level at 25th percentile and 75th percentile, respectively.
