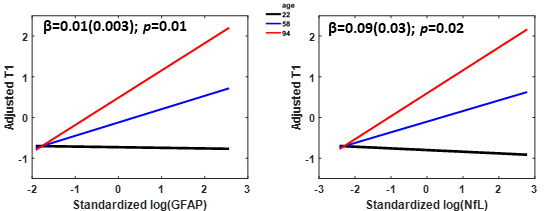
Figure 2.

Age-stratified association of GFAP and NfL with choroid plexus integrity. Age-stratified association between CP T1 and GFAP or NfL derived using a linear regression model adjusted for age, sex, BMI, and hypertension status. The age-stratified lines show the adjusted T1 as a function of GFAP or NfL, with age fixed at three specific values of 22 (black line), 58 (blue line), and 94 (red line) corresponding to the minimal, median, and maximal values, respectively. The adjusted response function describes the relationship between the fitted response and plasma biomarker (GFAP or NfL), with the other predictors averaged out by averaging the fitted values over the data used in the fit. The regression coefficient and p-value of the interaction term are displayed.
