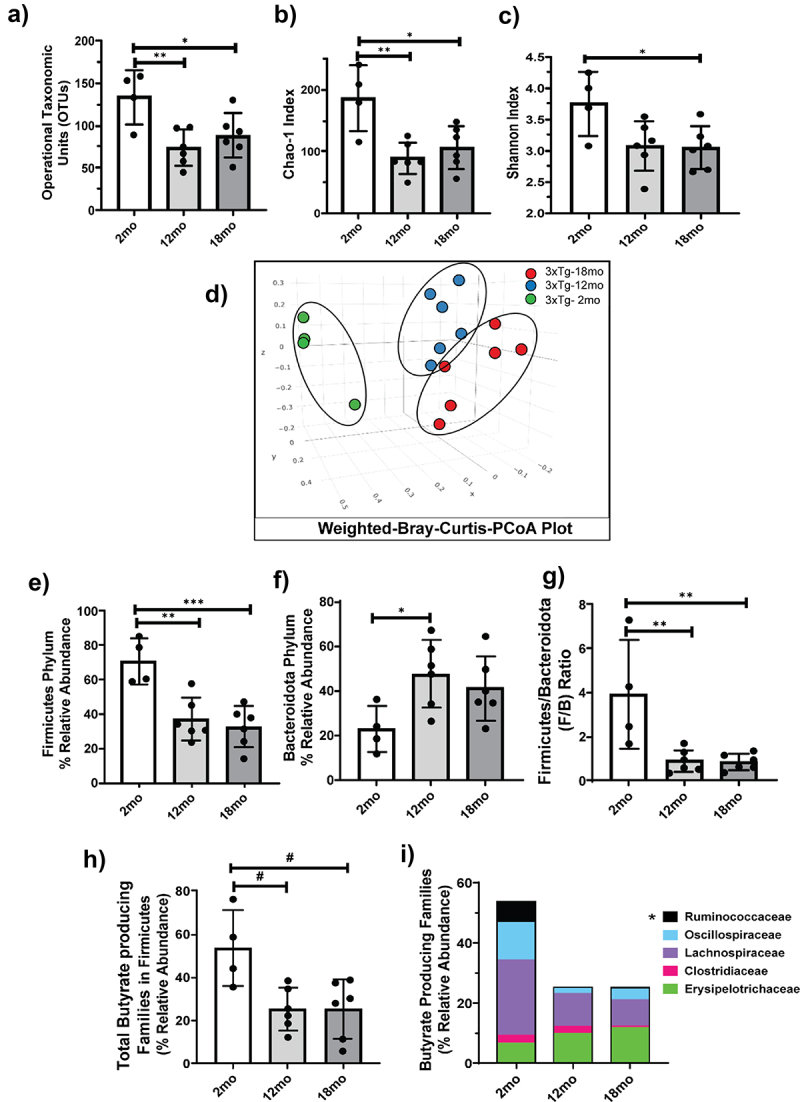
Figure 1.

Age-associated decrease in microbial diversity and alterations in microbial composition in 3×Tg mice.
Age-related changes in alpha diversity metrics OTUs a) and Chao1 Index b) measuring species richness and the Shannon Index c) measuring species abundance and evenness present in the cecal contents of indicated groups of 3×Tg mice are shown. Beta diversity PCoA plots d) depicting compositional differences were generated using Weighted Bray–Curtis distances for communities within the microbiome of 2, 12, and 18 month old 3×Tg mice. All pairwise comparisons for Beta diversity were calculated using ADONIS (R vegan package) and are significant at 0.05 using a Benjamani–Hochberg correction for multiple comparisons. Age-associated changes in relative abundance of Firmicutes phylum e), Bacteroidota phylum f), as well as the Firmicutes to Bacteroidota (F/B) ratio are shown g). The relative abundance of butyrate-producing communities from the Firmicutes phylum is shown for total h) and indicated bacterial families in a stacked bar graph i). Data are represented as mean ± SD (n = 4–6). Significance analyzed using one-way ANOVA with Tukey’s corrected measures are denoted as *p < 0.05, **p < 0.01, and ***p < 0.001. Student’s t-test statistical analyses are denoted as ‘#’ for p < 0.05.
