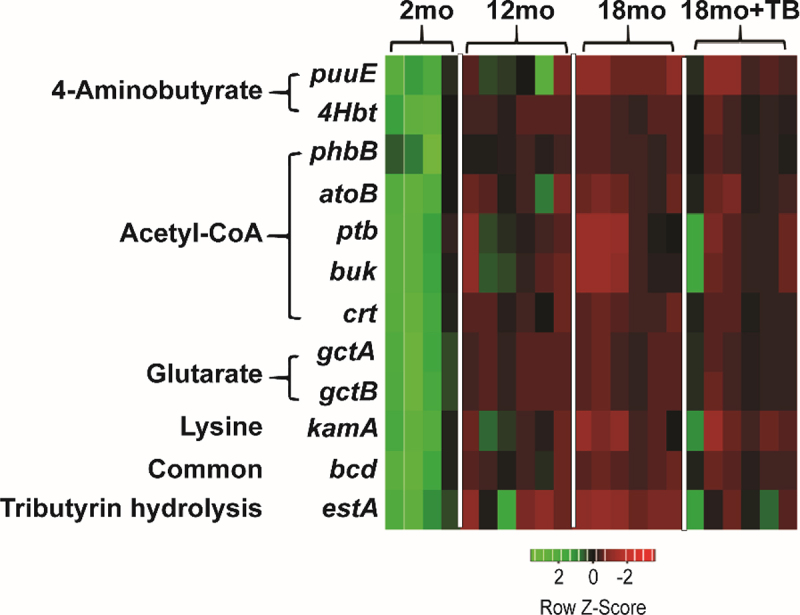
Figure 3.

Alterations in the abundance of butyrate-synthesizing genes observed in 3×Tg mice.
Heat maps were generated for 12 distinct butyrate synthesis associated genes as identified by PICRUSt2 analysis for 2, 12, 18 and 18 month+TB groups. The heat maps show genes from all four butyrate biosynthetic pathways, 4-aminobutyrate, acetyl-CoA, glutarate, lysine, and common pathways, as well as the putative tributyrin esterase that hydrolyzes TB to produce butyrate. The red color denotes the genes that are present in low abundance or absent and the green color denotes the genes that are highly abundant. puuE: 4-aminobutyrate transaminase, 4Hbt: butyryl-CoA:4-hydroxybutyrate CoA transferase, phbB: acetoacetyl-CoA reductase, atoB: acetyl-CoA acetyltransferase, ptb: phosphate butyryltransferase, buk: butyrate kinase, crt: crotonase, gctA: glutaconate CoA transferase (α subunit), gctB: glutaconate CoA transferase (β), gctA: glutaconyl-CoA decarboxylase (α, β subunits), kamA: lysine-2,3-aminomutase, bcd: butyryl-CoA dehydrogenase (including electron transfer protein α, β subunits, ter1-trans-2-enoyl-CoA reductase (NAD+)), estA: putative tributyrin esterase.
