
Figure 2.
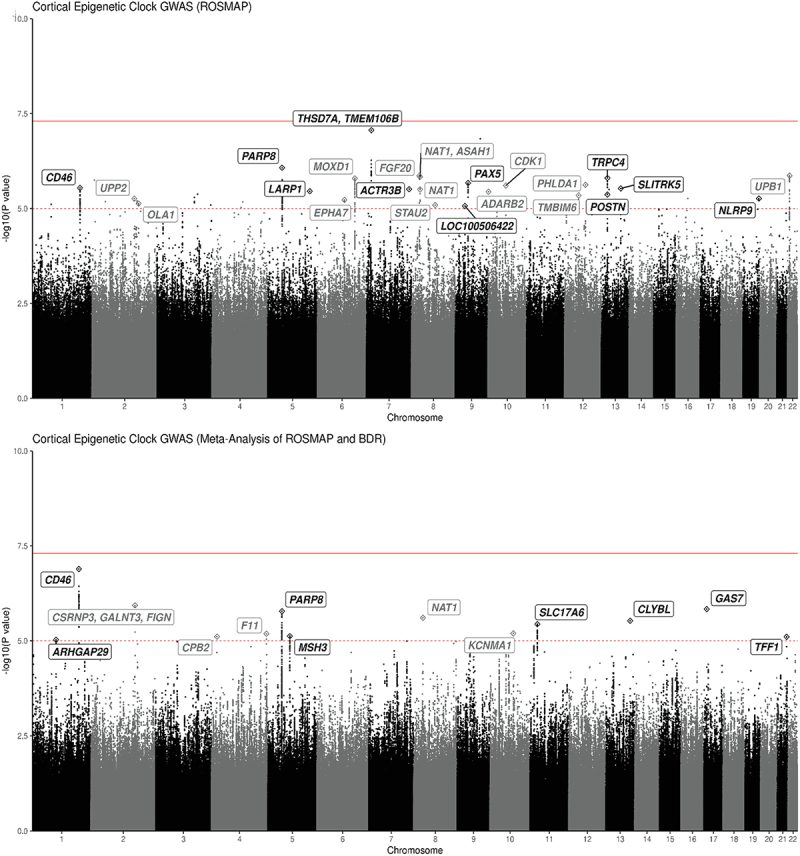
Manhattan plot: GWAS of cortical clock age for ROSMAP and Meta-analysis of ROSMAP/BDR.
* In the top panel, Manhattan plot shows the Cortical Epigenetic Clock GWAS results for ROSMAP. The bottom panel shows the GWAS results for the meta-analysis combining ROSMAP and BDR. Dashed red line represents a suggestive threshold of p = 10−5. The solid-line represents the genome-wide significance level of p = 5 × 10⁻⁸. Labels show the closest genes to GWAS lead SNPs with MAF >5%.