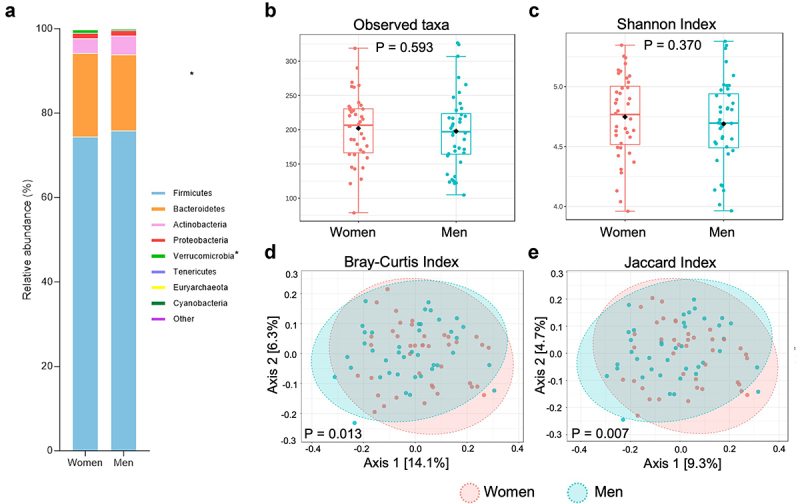
Figure 3.

Overall comparison of gut microbial profiles of men versus women. (a) Relative abundance of microbial taxa on phylum level in men versus women. FDR adjusted P-values of Q < 0.2, (*) were considered to be statistically significant. (b) Total observed ASVs (B) and Shannon index (c) as a measure for alpha diversity. Boxplots indicate the median and interquartile ranges (IQR). PCoA plots using the Bray-Curtis index (d) and Jaccard index to visualize the overall microbiota community variation. For (b-e): statistical significance (p < .05).
