
Figure 3.
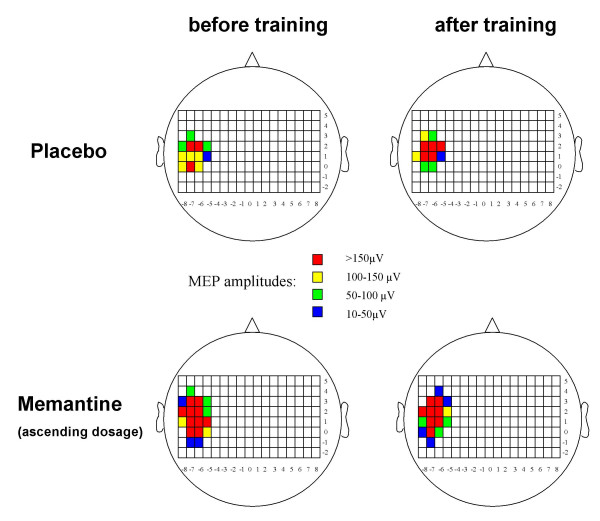
TMS mapping (individual subject). Example of the TMS mapping results in one individual subject who participated in the ascending dosage experiment. Different colours represent the MEP amplitudes after stimulation at the different scalp positions. Note the medial shift of the motor output map of the abductor pollicis brevis muscle after training in the placebo condition, which is no longer present in the memantine condition.