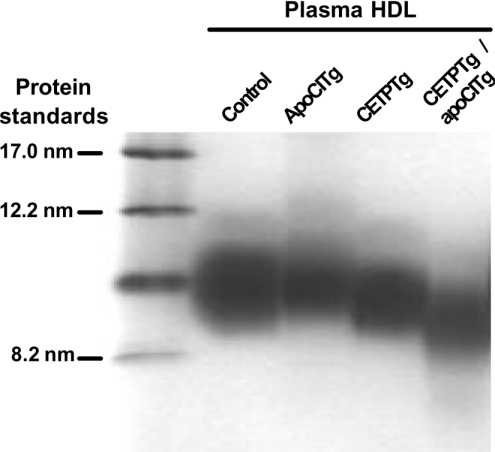
Figure 3. HDL size distribution in the plasma from control, apoCITg, CETPTg and CETPTg/apoCITg mice.
Total plasma lipoproteins were submitted to electrophoresis on 15–250 g/l polyacrylamide gradient gels that were stained for proteins as described in the Experimental section. The gel shown is representative of six distinct experiments, which were performed with plasma samples from six distinct mice for each genotype.

