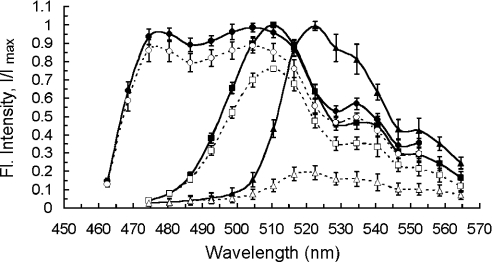
Figure 2. Excitation and emission spectra of GFP variants used in this study.
Normalized fluorescence emission spectra of CFP- (circles), GFP- (squares) and YFP-tagged (triangles) Ste2 proteins in yeast cells measured by a confocal microscope (see Experimental section) before (filled symbols, solid lines) and after (open symbols, dashed lines) 60 scans (approx. 30 s) by 514-nm light (photobleaching). Data are means±S.D. over n=21 (for CFP), n=23 (GFP) and n=52 (YFP) cells. Lines serve as guides to the eyes only.

