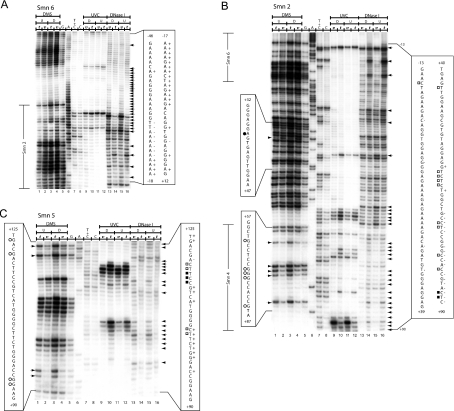
Figure 5. In vivo DNA footprint of the mouse Smn proximal promoter spanning nt −46 to +125.
(A) The region shown was analysed with primer set Smn6 to reveal upper strand sequences from nt −46 to +12 relative to the +1 TIS. Lanes 1–4, LMPCR of DNA purified from undifferentiated (U) (lanes 1 and 2) and differentiated (D) (lanes 3 and 4) P19 cells, treated with DMS in vitro (t) (lanes 1 and 3) after DNA purification or in vivo (v) (lanes 2 and 4) before DNA purification. Lanes 5–8, Maxam–Gilbert sequencing reactions. Lanes 9–12, LMPCR of DNA purified from differentiated (D) (lanes 9 and 10) and undifferentiated (U) (lanes 11 and 12) P19 cells, irradiated with UVC in vivo (v) (lanes 9 and 11) before DNA purification or in vitro (t) (lanes 10 and 12) after DNA purification. Lanes 13–16, LMPCR of DNA purified from differentiated (D) (lanes 13 and 14) and undifferentiated (U) (lanes 15 and 16) P19 cells, treated with DNase I in vivo (v) (lanes 13 and 15) before DNA purification or in vitro (t) (lanes 14 and 16) after DNA purification. (B) The region shown was analysed with primer set Smn2 to reveal upper strand sequences from nt −13 to +90 relative to the +1 TIS. Lanes 1–16 and footprint characteristics for DMS, UVC and DNase I are as described in (A). Overlapping sequences detected with primer sets Smn6 and Smn4 are annotated to the left of the Figure. (C) The region shown was analysed with primer set Smn5 to reveal bottom strand sequences from nt +125 to +90 relative to the +1 TIS. Lanes 1–16 and footprint characteristics for DMS, UVC and DNase I are as described in (A). DMS protection and hyperreactivity is indicated by ○ and ● respectively (displayed on the left). UVC protection and hyperactivity is indicated by □ and ■ respectively (displayed on the right). DNase I protection and hyperactivity is indicated by ‘−’ and ‘+’ signs respectively (displayed on the right). As a reference, the corresponding portion of the Maxam–Gilbert-derived sequence is shown on both sides of the autoradiogram. Arrows indicate footprinted bands. Regions covered by superposing primer sets are indicated at the far left of the autoradiogram. The sequence overlapping with primer set Smn2 is annotated to the left of the Figure.

