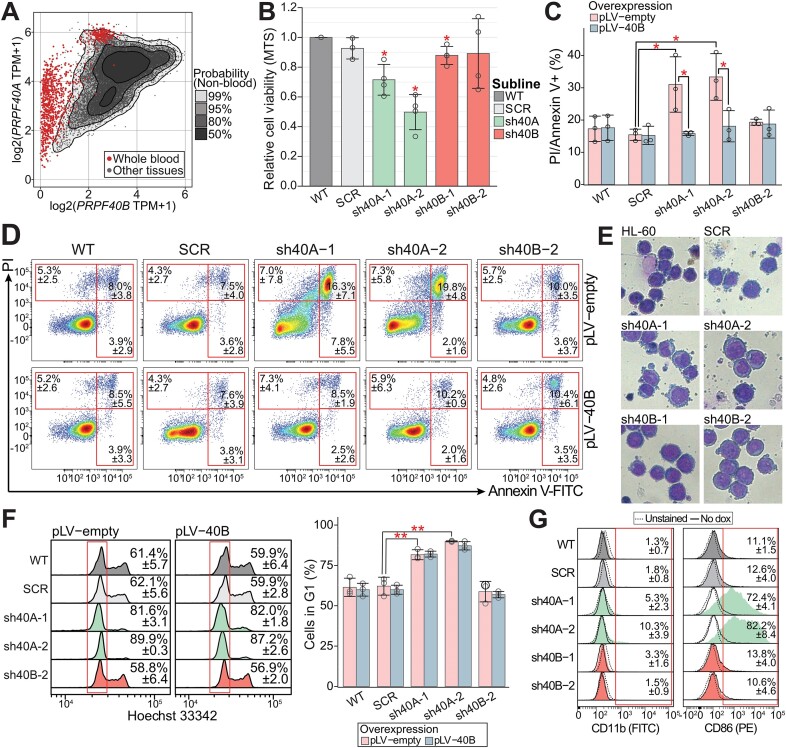
Figure 1.
Phenotypic characterization of PRPF40A/B knockdown HL-60 cells. (A) PRPF40A and PRPF40B expression in blood cells and other tissues (the leukemia data in Supplementary Figure S1B). Data obtained from the GTEx database. (B) Cell viability MTS assay relative to wildtype HL-60 showed that PRPPF40A-KD HL-60 cells were less proliferative. The statistical significance was calculated against SCR using the Student's t-test and corrected with the Benjamini–Hochberg method. (C) Increased cell death in PRPF40A-KD HL-60 cells was also observed with AnnexinV/PI apoptosis assay. This was rescued with the overexpression of PRPF40B. The statistical significance was calculated between the knockdown samples (empty vector) against the scrambled control (empty vector) or the corresponding PRPF40B overexpression samples using the Welch's t-test and corrected with the Benjamini–Hochberg method. (D) Representative density plot of Annexin V (FITC) versus PI. (E) Giemsa stain of wildtype HL-60 and knockdown sublines after doxycycline induction. (F) Cell cycle analysis with Hoechst 33342 and flow cytometry likewise revealed an increased proportion of cells in the G1 phase upon PRPF40A-KD (highlighted in the red box), but PRPF40B overexpression did not significantly improve proliferation. The statistical significance was calculated between the knockdown samples (empty vector) against the scrambled control or the corresponding PRPF40B overexpression sample using the Welch's t-test and corrected with the Benjamini–Hochberg method. No statistical significance was found between corresponding empty vector controls and PRPF40B overexpression samples. (G) Flow cytometry analysis of myeloid cell markers showed increased CD86 expression in PRPF40A knockdown HL-60 cells. The statistical significance in all panels is presented as *P< 0.05, **P< 0.01.

