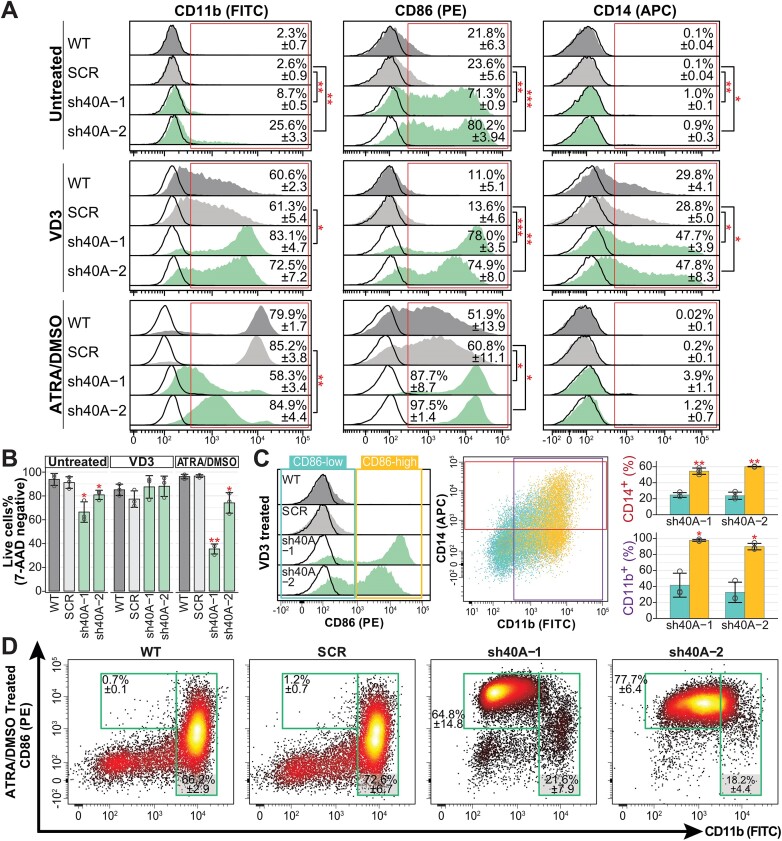
Figure 2.
Phenotypic effects of the depletion of PRPF40A in HL-60 myeloid cells. (A) Flow cytometry data of surface markers for wildtype HL-60 and knockdown sublines upon doxycycline induction followed by differentiation with VD3 or ATRA/DMSO for 4 days. Representative histogram plots of CD11b (FITC), CD86 (PE) and CD14 (APC), with isotype controls represented by the black curves. The mean percentage of marker-positive cells is indicated in the histograms. (B) Cell viability obtained with 7-AAD staining. (C) CD11b and CD14 expression of CD86-low/high population after VD3 treatment. (D) Relative density plot of CD11b versus CD86 for ATRA/DMSO treated cells. The statistical significance depicted in all panels was calculated against the respective SCR controls using the Student's t-test and corrected with Benjamini–Hochberg method. The statistical significance in all panels is presented as *P< 0.05), **P< 0.01.

