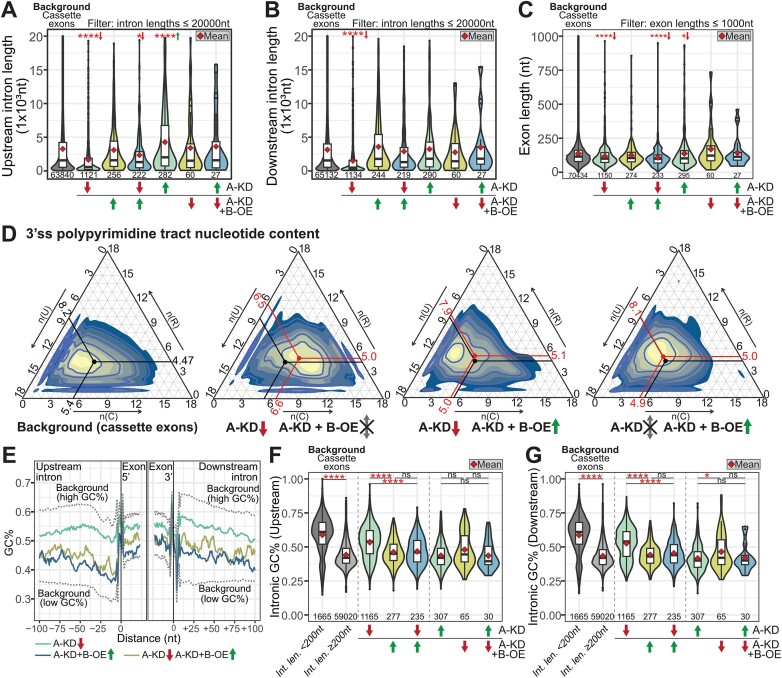
Figure 5.
Features of PRPF40A-regulated alternative splicing events in HL-60. (A–C) Distribution of intronic and exonic lengths of each differentially spliced cassette exon subset, with green and red arrows indicating up- and downregulation in the corresponding dataset. Mean values are indicated by the red diamond. The statistical significance between the background and each subset was calculated using the Wilcoxon's rank-sum test and corrected using the Benjamini–Hochberg method. The sample sizes are indicated below each violin plot. (D) Ternary plots of the nucleotide content of the 3′ss polypyrimidine tracts (18nt) for each indicated dataset. The black and red points indicate the mean values for the background and RNA-seq datasets, respectively. (E) Rolling window average (window of 5nt) plot of GC content for the indicated cassette exon subsets. The background values are indicated in dashed lines. (F, G) GC content of introns located up- and downstream of each cassette exon. The statistical significance within each group was calculated using the Kruskal–Wallis test within each subgroup (indicated by dashed lines) and corrected using the Benjamini–Hochberg method. The sample sizes are indicated below each violin plot. Int. len.: intronic length. The statistical significance in all panels is presented as *P< 0.05, ***P< 0.001, ****P< 0.0001. The arrows next to the asterisks indicate the direction of median change relative to background values.

