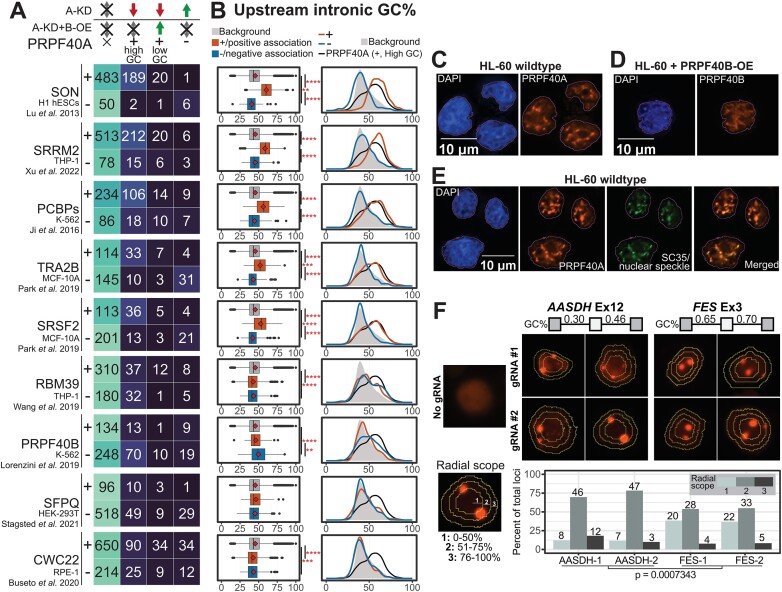
Figure 6.
Comparative meta-analysis reveals a subset of splicing factors with a common pattern of GC-rich splicing targets. (A) Overlap of differential cassette exons between each dataset and the PRPF40A/B target subsets, including exons downregulated by PRPF40A-KD and not rescued, downregulated exons rescued by PRPF40B-OE, and exons upregulated by PRPF40A-KD. The ‘+’ and ‘–’ indicate the exons that are positively and negatively associated with the expression of each splicing factor. The positively associated events are either upregulated in RBP overexpression datasets or downregulated in RBP knockdown datasets, while negatively associated events show the opposite trend. (B) Distribution of upstream intronic GC content for all human cassette exons (grey), positively correlated exons (+, orange) and negatively correlated exons (-, blue). The statistical significance within each group was calculated using the Wilcoxon's rank-sum test. **P< 0.01, ***P< 0.001, ****P< 0.0001. (C–E) Immunofluorescence assays for the localisation of the indicated splicing factors. The outlines indicate the DAPI-stained nuclear area. (F) Casilio-based tagging of genomic loci corresponding to exons flanked by lower GC content (AASDH Exon 12) and higher GC content (FES Exon 3). The concentric rings indicate the boundary of each radial scope, with the distribution of points across different cells indicated in the bar plot. For each gene, we summed up the loci counts across both gRNAs to get overall loci distributions, and applied the Kolmogorov–Smirnov test for the statistical differences between the AASDH and FES distributions (P-value as indicated).

