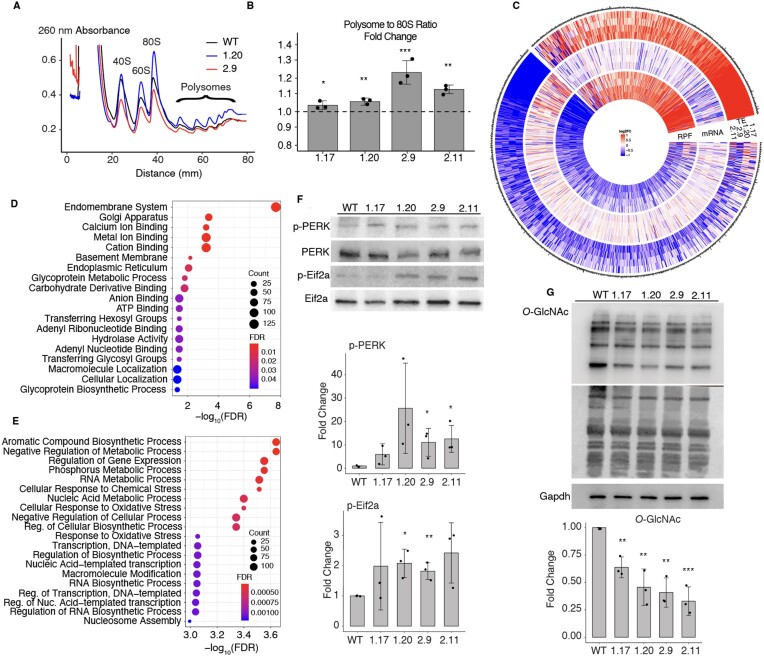
Figure 4.
Impact of RPL39L KO on mRNA translation. (A) Example polysome profiles from the WT, 1.20 and 2.9 RPL39L KO E14 cell lines. (B) Ratio of the area under the profile corresponding to polysomes vs. monosomes (80S), in polysome profiles obtained from the KO clones. Fold-changes were calculated relative to the median ratio in the corresponding WT (dashed line at 1, n = 3 for all cell lines). (C) Log2 fold-changes in the translation efficiency (TE), mRNA level and the number of ribosome protected fragments (RPF) for specific genes, in mutant clones relative to WT E14 cells (n = 3 for each clone). Shown are all genes with a significant change in TE in at least one of the RPL39L KO clones. Values are capped at −1 and 1. (D, E) Gene Ontology analysis of mRNAs with reduced (D) and increased (E) TE in RPL39L KO clones. (F) Representative western blots and corresponding quantification (from n = 3 for each clone) of UPR markers PERK (phospho-Thr980) and EIF2A (phospho-Ser51). Intensities of phosphorylated proteins were normalized by the respective unphosphorylated forms and are relative to WT, for which the relative phosphorylation level was set to 1. (G) Representative western blot and corresponding quantification (from n = 3 for each clone) showing lower global O-GlcNAc modification of proteins in RPL39L KO lines when compared to the WT. Values are relative to GAPDH (loading control) and WT (level set to 1). In all panels, *, ** and *** correspond to P-values <0.05, <0.01 and < 0.001, respectively in the two tailed t-test comparing KO lines with WT.

