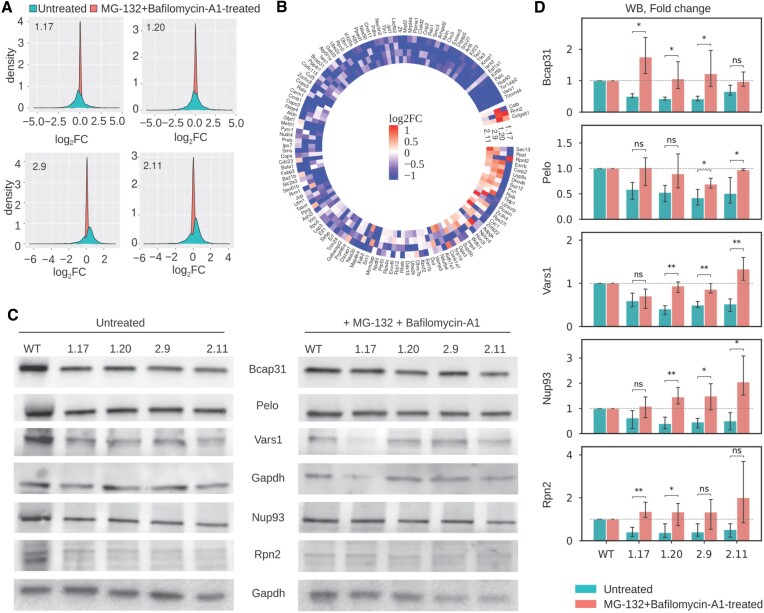
Figure 5.
RPL39L KO clones exhibit enhanced degradation of specific classes of proteins. (A) Distribution of log2 fold changes in protein levels between untreated (blue) or MG-132 + Bafilomycin-A1-treated RPL39L KO and WT cells. Each panel corresponds to one KO clone. Three biological replicates for each condition were used to calculate average protein abundance levels and respective fold-changes relative to WT. (B) Heatmap of protein-level Δlog2 fold changes in KO cells relative to WT between untreated and treated cells. Included are all proteins with a significant downregulation in at least one of the untreated KO clones. (C) Representative western blot results showing the expression of a subset of proteins from (B) in untreated (left) and MG-132 + Bafilomycin-A1-treated cells (right). (D) Quantification of western blots as shown in (B), from three replicates for each protein and each condition.

