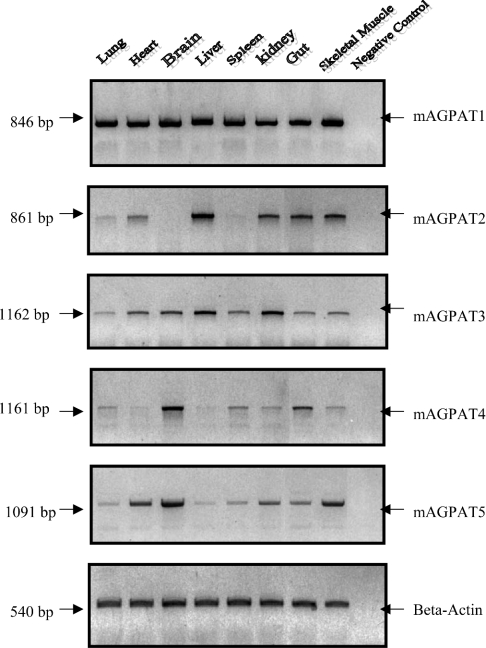
Figure 4. mRNA expression profiles of mAGPAT isoforms in murine tissues.
Total RNAs were extracted and RT–PCR was performed as described in the Materials and methods section. Gel images obtained from RT–PCR showed the expression of AGPAT mRNAs in murine tissues. Results were from three independent RT–PCRs and representative gels are shown.

