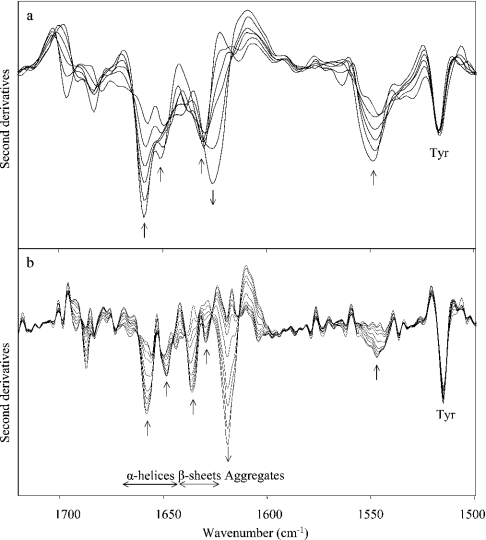
Figure 4. Thermal unfolding of CRL1.
Second derivative spectra of CRL1 as a function of temperature in the amide I and II regions at 20–100 °C in (a) water and (b) 2H2O. Spectral resolution as in Figure 2. Arrows point to the direction of increasing temperature.

