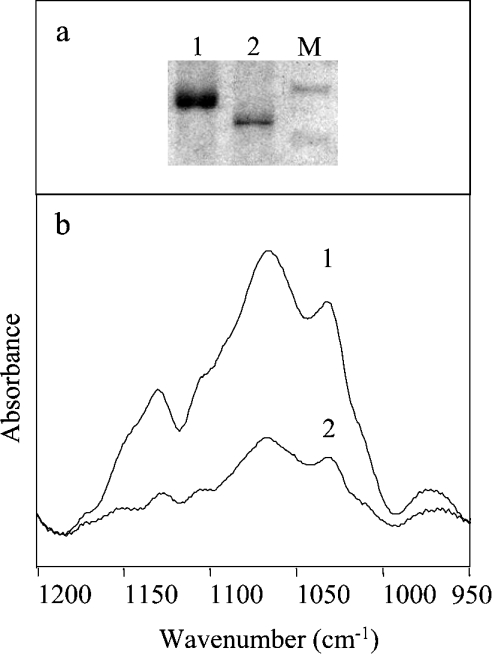
Figure 7. Deglycosylation of CRL1.
(a) SDS/PAGE of the CRL1 sample examined in (b), before lane (1) and after lane (2) PNGase F digestion. Molecular-mass standards (M) refer to 62 and 47.5 kDa. (b) FTIR absorption spectra in the carbohydrate region of CRL1 (1) and of CRL1 treated by deglycosydase (2), after normalization for protein content at the 1517 cm−1 tyrosine peak.

