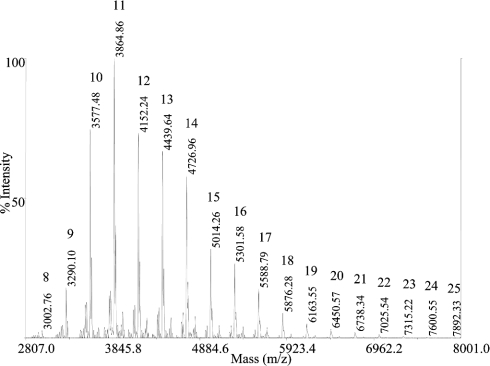
Figure 8. Glycoform analysis of CRL1.
MALDI-MS analysis of the oligosaccharides released from the protein (same sample of spectrum 1 in Figure 7b). Glycans were N-acetylated and directly analysed. Individual glycoforms are identified by their mass value, corresponding to two NAG units and a variable number of mannose residues. For each glycoform, the number of mannoses is reported. All mass signals correspond to the sodium adducts.

