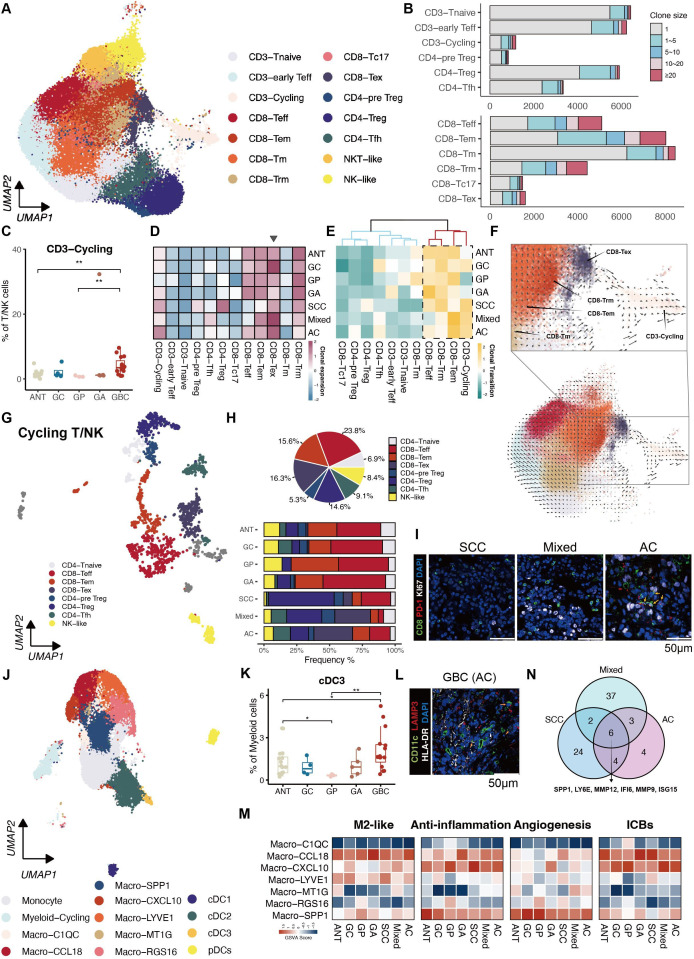
Figure 2.
Characterisation of immune cell states throughout disease progression. (A) UMAP showing illustrating distinct subsets of T/NK cells. (B) Clonal expansion status of T cells shown as cell counts. (C) Proportion of the CD3-Cycling among different groups. (D) Heatmap displaying the clonal expansion of each T subset stratified by tissue subtypes. (E) Heatmap revealing clonal transitions between CD8-Tex and other clusters, stratified by tissue subtypes. (F) RNA velocity overlaid on UMAP of T cells, demonstrating potential transitional paths to CD8-Tex. (G) UMAP exhibiting subpopulations of Cycling T/NK cells. (H) Proportions of subpopulations of Cycling T/NK cells in each tissue subtype represented by Pie chart (top panel) and bar plot (bottom panel). (I) Immunofluorescence staining illustrating the dominance of cycling CD8-Tex in AC compared with the other two GBC subtypes. (J) UMAP showing subsets of myeloid cells identified in monocytes, macrophages and DCs. (K) Proportion of cCD3 among different groups. (L) Immunofluorescence staining confirms the presence of cCD3 in GBC. (N) Venn diagram illustrates six overlapping genes representing TAMs in GBC. (M) Heatmaps showing distinct expression patterns of function-associated signature genes among seven macrophage subsets in tissue subtypes. AC, adenocarcinomas; ANT, adjacent normal tissues; cDC, classical DC; DC, dendritic cell; GA, gallbladder adenomas; GBC, gallbladder cancer; GC, gallbladder cholecystitis; GP, gallbladder polyps; NK, natural killer; NKT, natural killer T; pDC, plasmacytoid DC; SCC, squamous cell carcinoma; TAM, tumour-associated macrophage; Teff, effector T; Tem, effector memory T; Tex, exhausted T; Tfh, follicular helper T; Tm, memory T; Treg, regulatory T; Trm, tissue-resident memory T; UMAP, Uniform Manifold Approximation and Projection.

