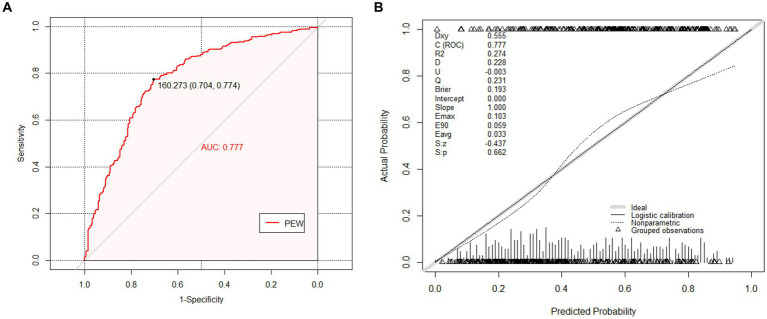
Figure 2.
The receiver operating characteristic (ROC) curves and calibration curves of the external validation cohort. (A) The ROC curves of nomogram in external validation cohort (AUC = 0.777, 95% CI 0.741–0.814). The nomogram was the prediction model for predicting risk of Protein Energy Wasting (PEW) in maintenance hemodialysis (MHD) patients that we want to verify. (B) The calibration curves of the nomogram in external validation cohort. It demonstrated the clinical effectiveness of the nomogram by comparing the predicted risk and actual risk assessment. The calibration curves showed good agreement between prediction and observation in the probability of PEW.

