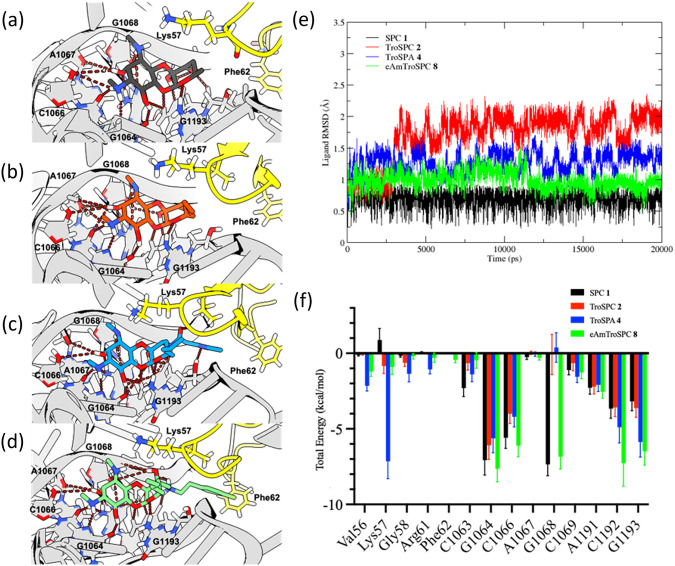
Fig. 2.
Modeled binding poses of SPC 1 in black (a), TroSPC 2 in red (b), TroSPA 4in blue (c), and N-ethylene linked AmTroSPC 11in green (d). Images are from the final frame of a 20 ns MD simulation in AMBER22 (e, f). Hydrogen bond interactions with nucleic acids G1064, C1066, A1067, G1068, A1191 and G1193 are shown in red and with Lys57 highlighted in yellow. MD simulation trajectory for a 20 ns MD simulation with protein backbone RMSD (e) and ligand position RMSD (f) for each docked system

