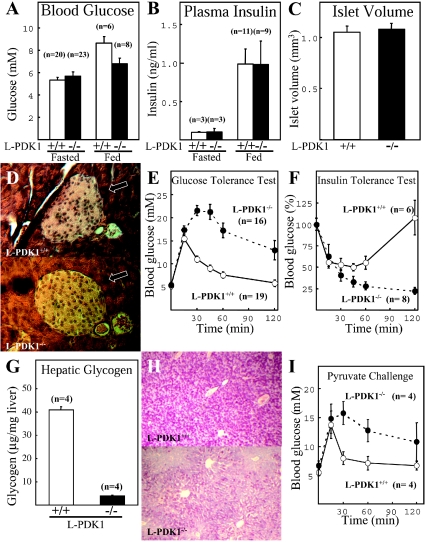
Figure 4. Characterization of glucose homoeostasis in L-PDK1−/− mice.
The indicated number (n) of mice were left in the absence (Fasted) or presence (Fed) of food overnight and the blood glucose levels (A) or plasma insulin (B) levels were measured. (C) The total volume of islet cells in the pancreas of the indicated mice was measured using the unbiased Cavalieri method [19]. (D) A representative histological pancreas section of the indicated mice probed with haematoxylin and eosin stain that enables visualization of the islet cells that are indicated with an arrow. (E) Mice deprived of food overnight were injected intraperitoneally with glucose, and blood glucose concentration was measured at the indicated times. (F) Normally fed mice were injected intraperitoneally with insulin and blood glucose levels measure at the indicated times. (G) Glycogen levels in the liver of normally fed mice were determined. (H) A representative histological liver section of the indicated mice probed with the periodate–Schiff stain that recognizes carbohydrates. (I) Mice that were starved overnight were injected intraperitoneally with pyruvate, and blood glucose concentration was measured at the indicated times. The data are presented as the means±S.D. where n corresponds to the number of animals used for each determination.

