
FIGURE 3.
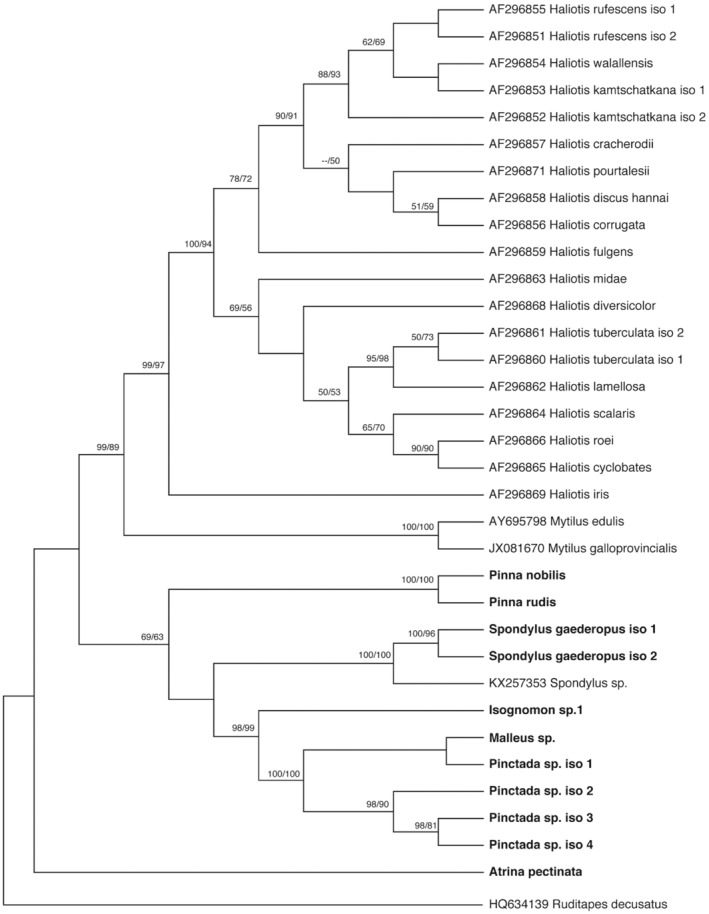
Phylogenetic relationships based on ITS sequences from various bivalve families. Bootstrap values from neighbour‐joining and maximum likelihood analyses greater than 50% are shown below the nodes, respectively.
Official websites use .gov
A
.gov website belongs to an official
government organization in the United States.
Secure .gov websites use HTTPS
A lock (
) or https:// means you've safely
connected to the .gov website. Share sensitive
information only on official, secure websites.
Phylogenetic relationships based on ITS sequences from various bivalve families. Bootstrap values from neighbour‐joining and maximum likelihood analyses greater than 50% are shown below the nodes, respectively.