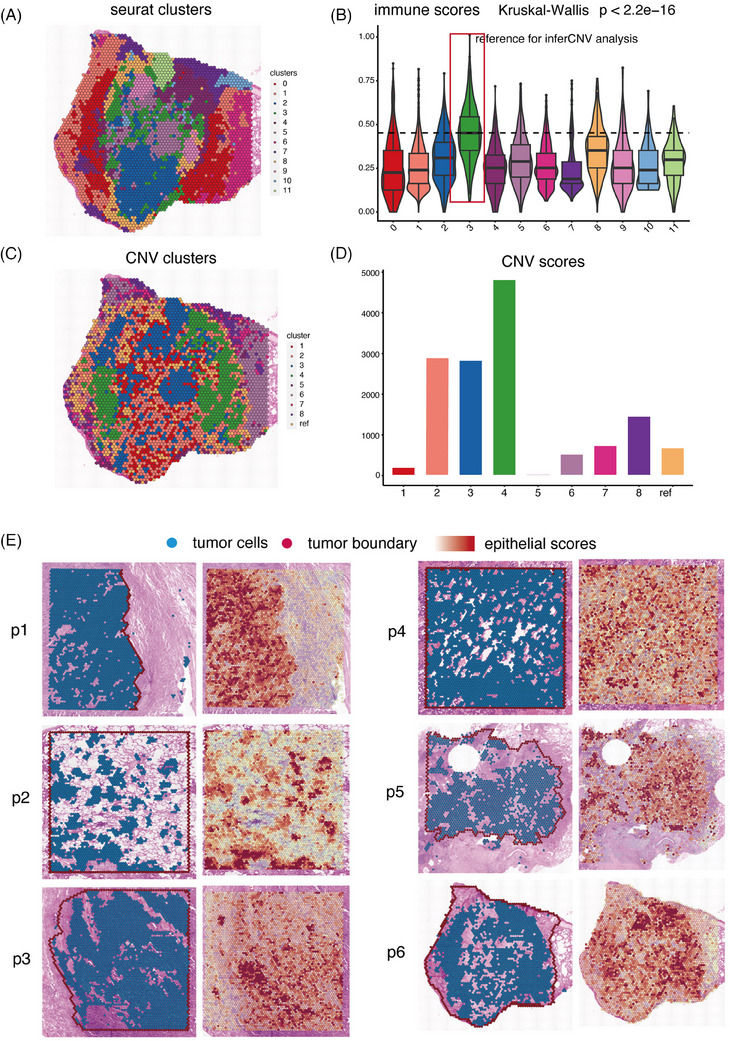
FIGURE 1.

The identification of malignant cells in spatial transcriptomics (ST) data. (A) Clustering of 4796 spots in patient 6 (p6) into 11 distinct clusters. (B) Distribution of immune score including pan‐immune markers (PTPRC), pan‐T‐cell markers (CD2, CD3D, CD3E and CD3G), B‐cell markers (CD79A, MS4A1 and CD79B) and myeloid cell markers (CD68 and CD14) in the 11 clusters. (C) Hierarchical clustering assigning all spots in p6, except the reference cluster, into eight clusters. (D) Bar charts showing the distribution of copy number variation (CNV) score in the nine clusters. (E) The plot depicted the identified tumour cells and the distribution of tumour‐specific epithelial score in six tumour samples.
