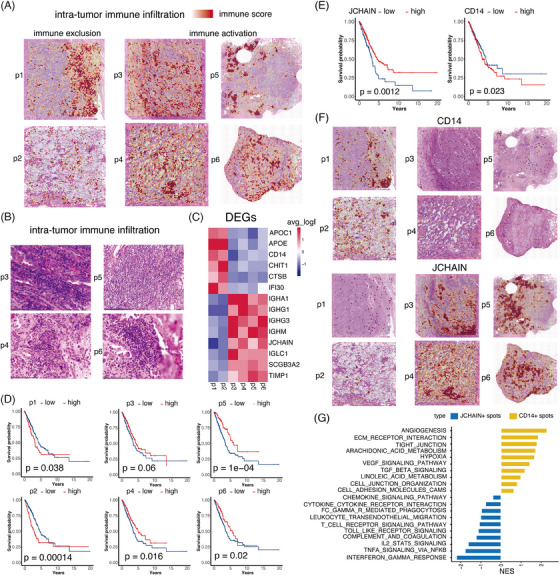
FIGURE 2.

Immune activation and immune exclusion patterns in non‐small cell lung cancer (NSCLC). (A) The plot depicted the distribution of immune score in six NSCLC samples. (B) The corresponding haematoxylin‒eosin staining (HE) images of p3 to p6 displayed the infiltrated immune clusters observed from spatial transcriptomics (ST) data. (C) The differentially expressed genes (DEGs) of the immune clusters in p3 to p6, respectively. (D) The role of infiltrated immune signature (top 50 DEGs) of p3 to p6 in patients’ survival, respectively. (E) CD14 as the macrophage marker and JCHAIN as the plasma cell marker showed the adverse and favourable role in NSCLC patient’ survival, respectively. (F) Distribution of the macrophage marker CD14 and the plasma cell marker JCHAIN. (G) The enriched pathways in CD14+ and JCHAIN+ spots.
