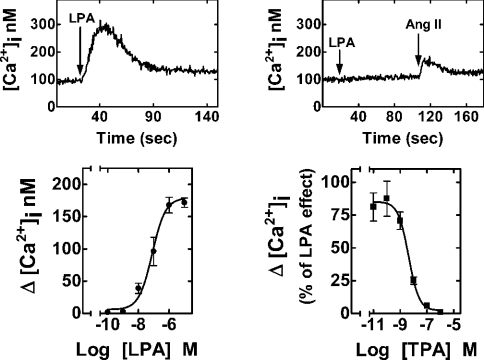
Figure 1. Effects of LPA and PMA on [Ca2+]i.
C9 cells endogenously expressing LPA receptors were loaded with fura 2. Representative [Ca2+]i traces are presented in cells challenged with 1 μM LPA (upper left panel) or treated with 1 μM PMA for 5 min and then challenged with 1 μM LPA and subsequently with 100 nM angiotensin II (upper right panel). Lower left panel: effect of different concentrations of LPA on [Ca2+]i. Lower right panel: effect of different concentrations of PMA (TPA) on the increase in [Ca2+]i induced by 1 μM LPA. In the lower panels, mean values are plotted and vertical lines represent the S.E.M. for 6–12 experiments using different cell preparations. Where no vertical lines are shown, they are within the symbols.

