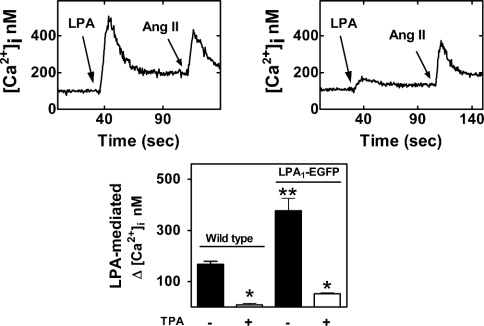
Figure 4. Effects of LPA and PMA on [Ca2+]i in cells stably expressing LPA1–EGFP.
C9 cells expressing LPA1–EGFP receptors were loaded with fura 2. Representative [Ca2+]i traces are presented in cells challenged with 1 μM LPA and subsequently with 100 nM angiotensin II (upper left panel) or treated with 1 μM PMA for 5 min and then challenged with 1 μM LPA and subsequently with 100 nM angiotensin II (upper right panel). Lower panel, comparison of the effects of 1 μM LPA in wild-type cells or cells expressing LPA1–EGFP receptors, and pretreated without or with 1 μM PMA for 5 min. Mean values are plotted and vertical lines represent the S.E.M. for six experiments using different cell preparations. *P<0.001 versus absence of PMA; **P<0.001 versus wild-type.

