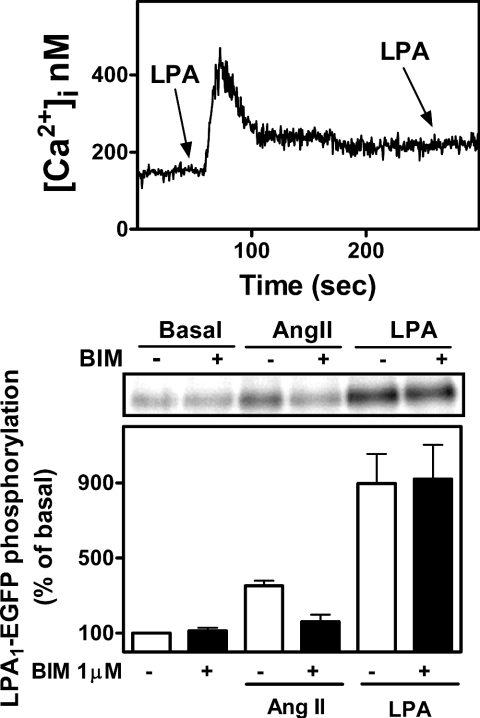
Figure 6. Homologous desensitization and effects of LPA and angiotensin II on LPA1–EGFP receptor phosphorylation.
Upper panel: representative [Ca2+]i trace of cells challenged with 1 μM LPA followed by a second 1 μM LPA stimulation. Lower panel: cells were preincubated in the absence or presence of 1 μM bisindolylmaleimide for 30 min and then challenged with 100 nM angiotensin II (Ang II) or 1 μM LPA. Results are expressed as the percentage of LPA1–EGFP receptor basal phosphorylation. Mean values are plotted and vertical lines represent the S.E.M. for three determinations using different cell preparations. A representative autoradiograph is presented.

