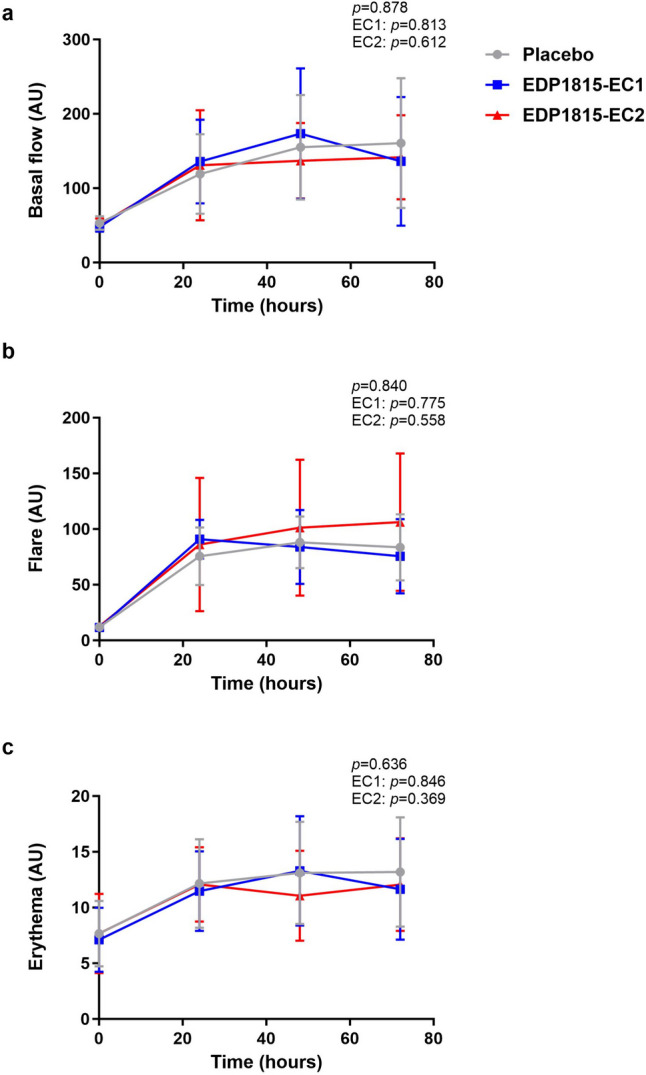
Fig. 3.

Treatment effect on imaging outcomes of imiquimod challenge. Basal flow (AU) (a), flare (AU) (b) and erythema (AU) (c) of imiquimod-treated skin during the imiquimod challenge, measured by laser speckle contrast imaging (LSCI) and multispectral imaging. Mean (standard deviation). AU arbitrary unit. p-values refer to the following contrasts: upper p-value EDP1815 overall vs placebo; EC1 EDP1815-EC1 vs placebo; EC2 EDP1815-EC2 vs placebo
