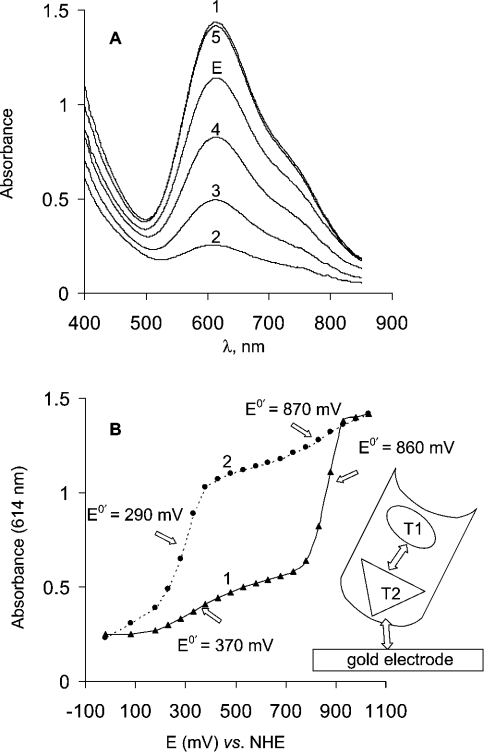
Figure 4. Mediatorless spectroelectrochemical redox titration of T. hirsuta laccase by using a gold capillary cell.
(A) Absorbance spectra recorded during redox titration of T. hirsuta laccase in the spectroelectrochemical gold capillary cell. The experiments were performed in 0.1 M phosphate buffer, pH 6.5. Curves E and 1–5 are absorbance spectra of initially injected enzyme and at applied potentials −20, 530, 830 and 1030 mV respectively. (B) Spectroelectrochemical titration curves reflecting the dependence of absorbance of the laccase solution at 614 nm versus the applied potential. Titration curves recorded by changing the applied potential (curve 1) from −20 to 1030 mV and (curve 2) from 1030 to −20 mV.

