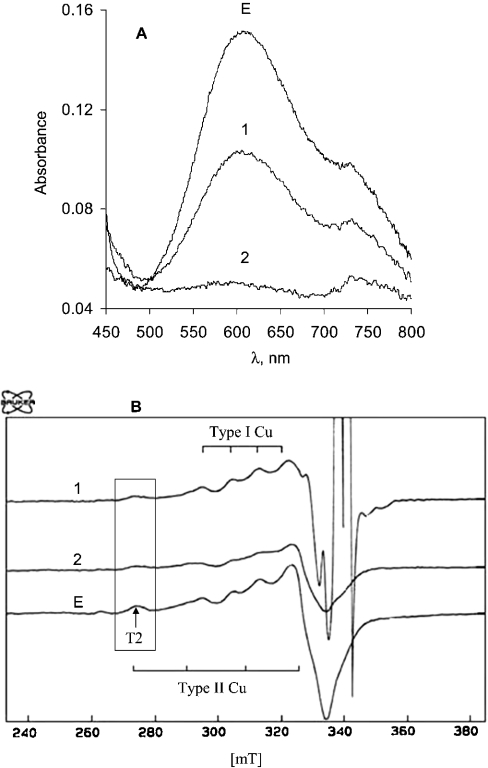
Figure 5. Absorption (A) and EPR (B) spectra of T. hirsuta laccase during the redox titration by different mediators.
The experiments were performed in 0.1 M phosphate buffer, pH 6.5. Spectrum E characterizes the solution of laccase before addition of mediators. Spectrum 1 was recorded after mixing the enzyme with K3Mo(CN)8 and K4Mo(CN)8 (the redox potential after equilibrium, 770 mV versus NHE). Spectrum 2 was recorded after mixing the enzyme with K3Fe(CN)6 and K4Fe(CN)6 (the redox potential after equilibrium, 450 mV versus NHE).

