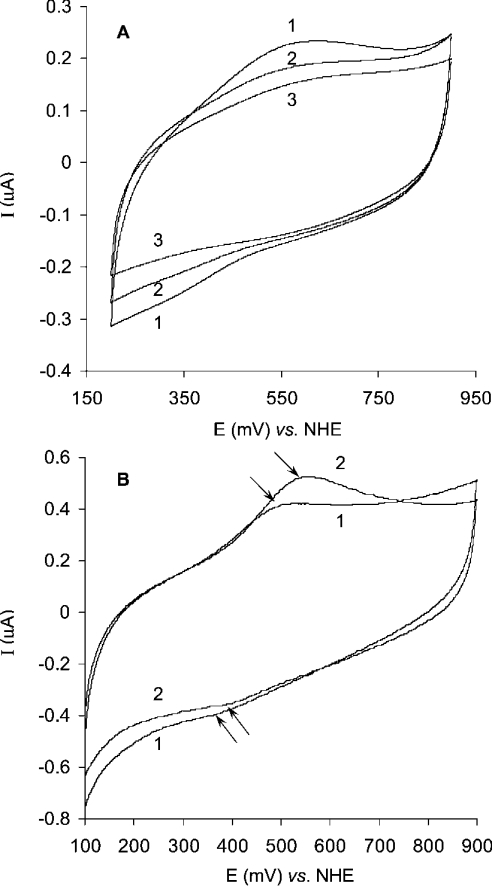
Figure 6. Cyclic voltammograms of laccase on the planar gold electrode.
The experiments were performed in 0.1 M phosphate buffer, pH 6.5. (A) Curve 1, native enzyme; curve 2, partly T2-depleted laccase; curve 3, apoenzyme. Laccase concentration, 4 mg/ml; scan rate, 10 mV/s; start potential, 900 mV versus NHE. (B) Curve 1, native enzyme; curve 2, after interaction with F− ions (10 mM) for 10 min. Laccase concentration, 7 mg/ml; scan rate, 50 mV/s; start potential, 100 mV versus NHE.

