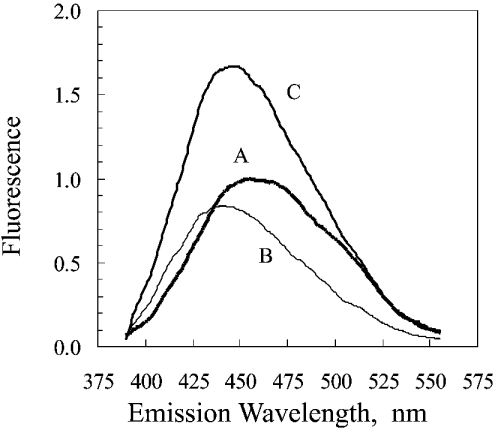
Figure 1. Fluorescence spectra of NADPH and catalase-bound NADPH.
The majority of the present study was based on the approach used by Hillar et al. [12]. The excitation wavelength was 340 nm. The spectra are of the following in 0.05 M phosphate buffer, pH 6.5, after subtraction of the spectrum of the phosphate buffer: A, 1.0 μM NADPH; B, 1.0 μM bovine liver catalase; C, 1.0 μM catalase that had been exposed to NADPH. Exposure to NADPH was carried out by incubating, for 30 min at 25 °C, 1.2 ml of a solution consisting of 40 μM catalase, 42 μM NADPH and 0.05 M phosphate buffer, pH 6.5, then removal of the unbound NADPH by chromatography on a 1.5 cm×14 cm column of G-25 Sephadex. The fluorescence intensity was standardized so as to give a value of 1.0 for the maximum reading of the 1.0 μM NADPH.

