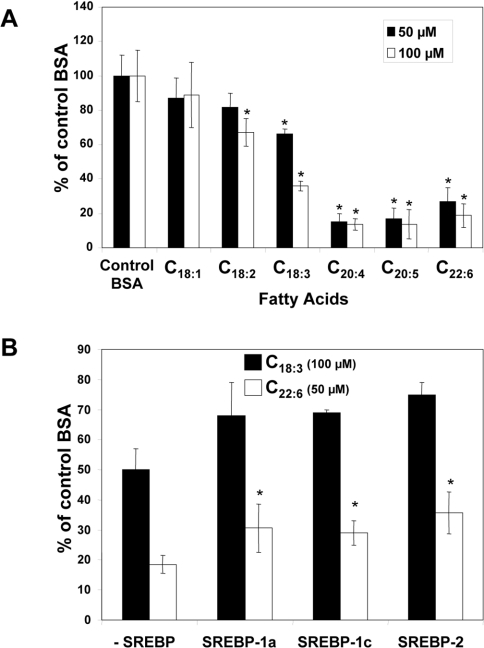
Figure 4. Transcriptional analysis in H4IIEC3 cells.
(A) Cells were transiently transfected with pGL3-FFPS317 plus pCMVβ-gal with Lipofectin® for 4 h. Cells were then incubated for 18 h with BSA alone or with 50 or 100 μM fatty acid. Luciferase and β-galactosidase activities were determined as described in the Materials and methods section. Data are expressed as percentages of values following control BSA treatment, and represent results from at least three experiments performed in triplicate. In the treatments with 50 μM fatty acid, the BSA concentration was 25 μM, while it was 50 μM in the presence of 100 μM fatty acid.*P<0.05, statistically different from control (Student's t test). (B) Cells were transiently transfected with pGL3-FPPS317, pCMVβ-gal and an expression vector for SREBP-1a, -1c or -2 (or empty vector as a control). After transfection, cells were incubated with BSA alone or with 100 μM linolenate (C18:3) or 50 μM DHA (C22:6) for 18 h. Activities were measured as in (A). Data are expressed as percentages of values following control BSA treatment, and represent results from at least three experiments performed in triplicate. *P<0.05, statistically different from control (Student's t test).

