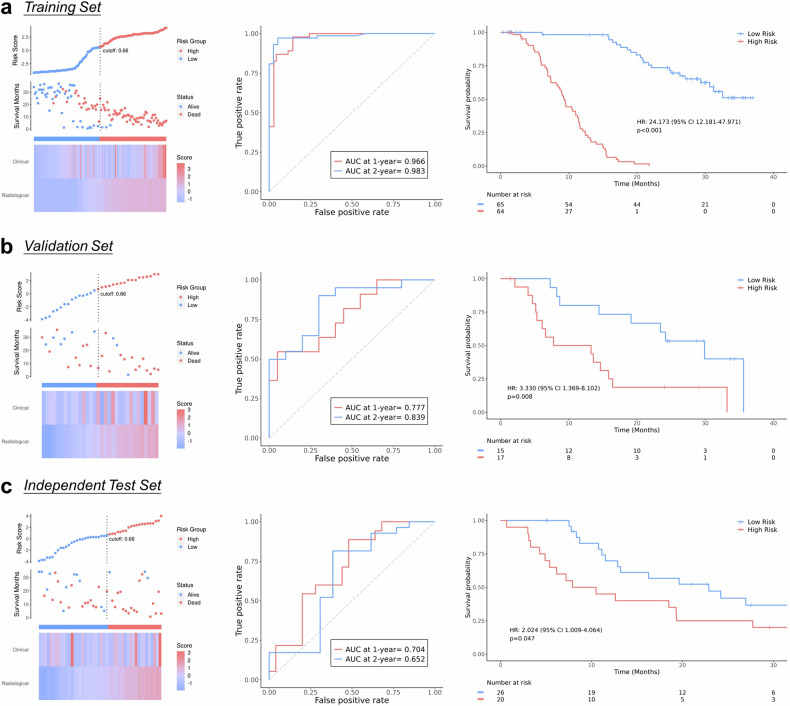
Fig. 3.
Performances of RadCLN-D. Left, the distributions of risk scores based on the multi-modal predictions are presented. Heatmaps are displayed to illustrate the distribution levels of the two modalities (radiological and clinical). Middle, time-dependent ROC curves at 1-year and 2-year. Right, Kaplan–Meier survival estimates for the OS, were stratified into low-risk and high-risk groups according to the median risk score in the training set. AUC, area under the curve; HR, hazard ratio

