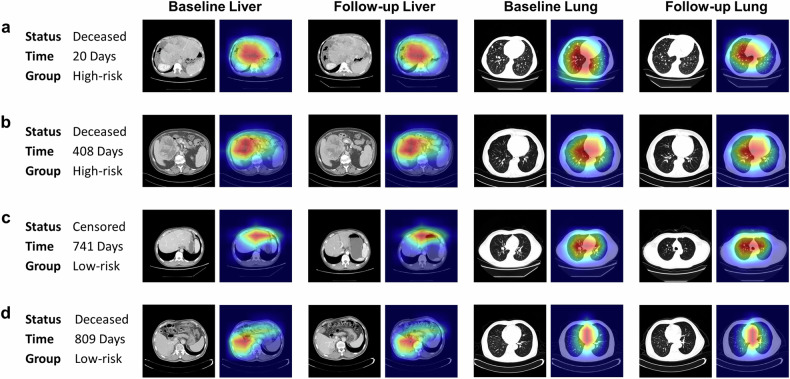
Fig. 5.
Interpretation of the deep learning model. Grad-CAM computes the gradients of the target class’s score (i.e., the risk score) with respect to the feature maps in the last convolutional layer of the network. These gradients are then weighted by the average pooling of the gradients to obtain the importance weights of the feature maps then normalized to [0,1] (with the blue color close to zero and the red color close to one) and linearly combined with the original feature maps. The four demonstrated cases are selected from the independent test set. a, b Two patients with model-predicted high-risk. c, d Two patients with model-predicted low-risk

